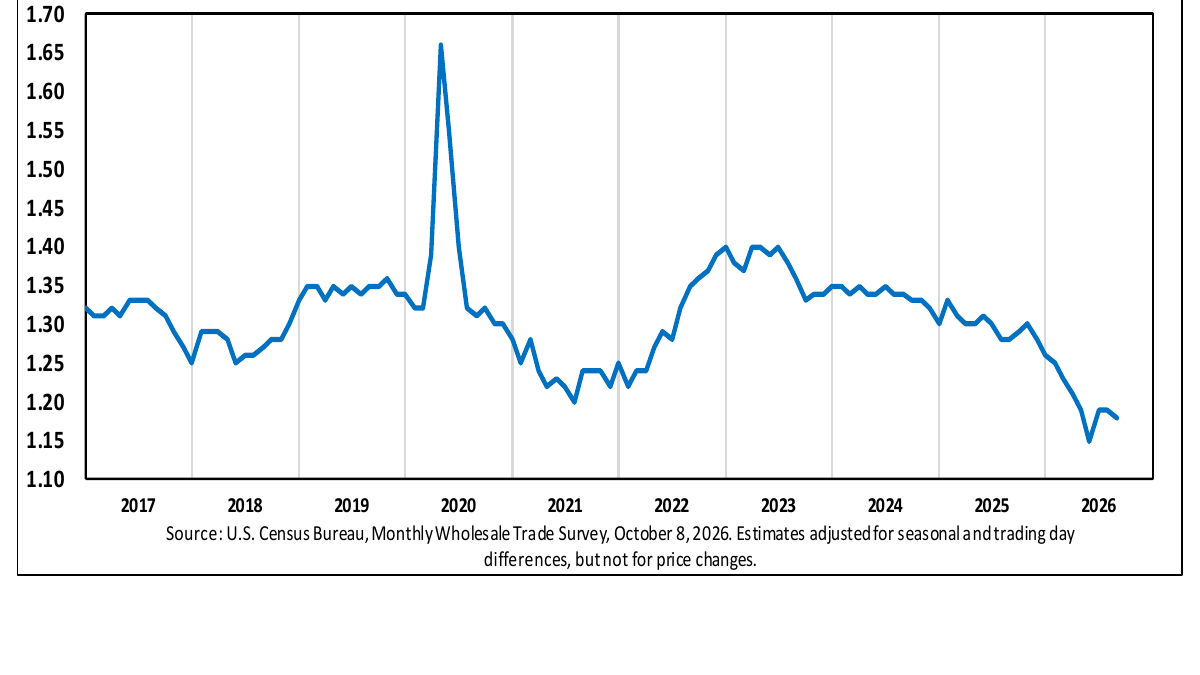
U.S. wholesalers sold more goods in August, and the inventory in warehouses continued to increase at the end of the month, although the rates of increase were different. On October 8th, the U.S. Census Bureau announced that after excluding sales by manufacturers' branches and offices, commercial wholesalers' seasonally and trading-day adjusted sales for that month amounted to $817.5 billion, a 1.8% increase from revised July figures and a 15.6% increase from August 2025. Inventory at the end of August was $964.2 billion, up 0.5% from July and 6.4% year-on-year. Calculated based on monthly sales rates, the inventory-to-sales ratio was 1.18, lower than the 1.28 from a year earlier. If one only focuses on the phrase "increasing inventory," they will miss the more important signal of even faster sales growth.
There is also a note that cannot be overlooked in this data: both sales amounts and inventory levels are nominal figures, which have been adjusted for seasonal and trading day variations, but price changes have not been taken into account. Therefore, a year-on-year increase of 15.6% does not necessarily equate to a 15.6% increase in the actual number of wholesale units sold; price changes, product composition, and quantity can all contribute to the variation in amounts. A decrease in the inventory-to-sales ratio does not automatically indicate a shortage in the supply chain; it may reflect faster sales or could be related to price and product mix factors. To understand wholesale data properly, it is necessary to separate the amounts, turnover rates, and actual quantities of goods.
The acceleration of sales and the increase in inventory do not contradict each other.
Wholesalers are situated between producers and retailers, as well as institutional customers, serving as an intermediary link in the flow of goods. An increase in sales indicates that downstream purchasing power is stronger than last month, while an increase in inventory suggests that the amount of goods available for sale at the end of the month has also increased. These two phenomena are not mutually exclusive: a company may sell goods more quickly on one hand while replenishing stock to meet subsequent demand on the other. In August, the year-on-year sales growth of 1.8% was significantly higher than the 0.5% increase in inventory, resulting in the inventory-to-monthly-sales ratio dropping to 1.18. Roughly speaking, if the sales pace and inventory structure remained unchanged, the inventory at the end of the month would correspond to about 1.18 months' worth of sales; however, in actual operations, factors such as delivery cycles, returns, price changes, and variations across different product categories mean that this ratio cannot be used as a reliable indicator of how many more days' worth of goods can be sold.
The year-on-year gap is also noteworthy. Sales volume increased by 15.6% year-on-year, while inventory only increased by 6.4%, so the inventory-to-sales ratio in August this year is lower than last year. This combination may indicate that channels respond more quickly to sales, but it could also lead to pressure to restock inventory. To determine which scenario is at play, it is necessary to look at the details of the products and subsequent months: if orders remain strong and the inventory-to-sales ratio continues to decline, wholesalers may increase their purchases; if it is just a nominal surge in sales driven by prices, then the improvement in inventory turnover may not be as significant as it seems. For manufacturers, changes in the wholesale segment are one of the signals of demand, but they cannot replace data on end-consumer consumption, order cancellation rates, or actual shipment volumes.
The Bureau of Population Statistics also revised the data for July. The preliminary estimate of sales growth from June to July was previously 0.8%, which has been revised to 1.0% this time. The increase in inventory in August was previously estimated at 0.7%, but in the final report, it has been revised to 0.5%. This detail is important for interpreting trends: monthly indicators can change as more corporate reports are included in the sample. If the old July sales figures and the new August inventory figures are mixed together, the resulting growth trajectory will not be consistent. Reports should be based on the revised figures from the same report and clearly indicate "revised," and preliminary values should not be presented as if they were unchanging historical facts.
The official report provides an estimated range of sampling error. In August, sales increased by 1.8% month-on-month, with a reported error margin of plus or minus 0.2 percentage points; inventory also increased by 0.5% month-on-month, with the same error margin of plus or minus 0.2 percentage points. The annual year-on-year sales growth of 15.6% has an error margin of plus or minus 0.7 percentage points, and the annual year-on-year inventory growth of 6.4% has an error margin of plus or minus 1.1 percentage points. For macroeconomic readers, this is not just for decorative purposes in the report: if small fluctuations are close to the sampling error, conclusions should be drawn more cautiously; however, the gap between the month-on-month increases in sales and inventory is worth continued observation.
A decline in the inventory-to-sales ratio is worth monitoring, but it does not necessarily imply an "acceleration of economic growth."
Wholesale sales are influenced by a combination of retail restocking, industrial production, imports and exports, energy trends, and the cycles of durable goods. If consumers are willing to buy, retailers may place additional orders with wholesalers; manufacturing companies preparing to increase production will also lead to an increase in the procurement of intermediate products. However, if prices suddenly rise for certain types of goods, nominal sales figures could also surge. The report clearly states that no price adjustments were made, so it is not possible to directly convert the dollar amount for this month into an actual growth rate of demand, nor can we infer the GDP growth rate from wholesale sales alone. Macroeconomic assessments should take into account retail sales, industrial output, trade, and price indices.
For enterprises, the practical value of the inventory-to-sales ratio lies in checking whether funds and the supply chain are coordinated. A high ratio may indicate backlogs of goods, pressure to discount products, and the occupation of cash; a low ratio may suggest that replenishments cannot keep up with demand, or it could simply reflect more efficient inventory management. The change from 1.28 last year to 1.18 indicates an improvement in turnover, but there is no universally accepted "healthy range" across different industries. The storage requirements for food and pharmaceuticals, the delivery cycles for automobiles and machinery, and the price sensitivity of fuels and raw materials all vary. A national aggregate indicator is suitable for assessing overall trends but should not be directly used to set inventory targets for a particular company.
The conclusions that can be drawn from this release are relatively clear: in August, the nominal sales growth of wholesalers in the United States outpaced the increase in inventory at the end of the month, and the inventory-to-sales ratio declined compared to the same period last year; both the preliminary estimates for July and August were subsequently revised. However, this does not alone prove a significant expansion in actual demand for goods, nor does it indicate a shortage of inventory. The next meaningful points to observe are whether monthly sales will continue to rise, whether inventory replenishment will accelerate, and what role price factors play in the year-over-year increase. By separating these issues, we can avoid making judgments about the entire commodity circulation chain based on a single impressive percentage figure.