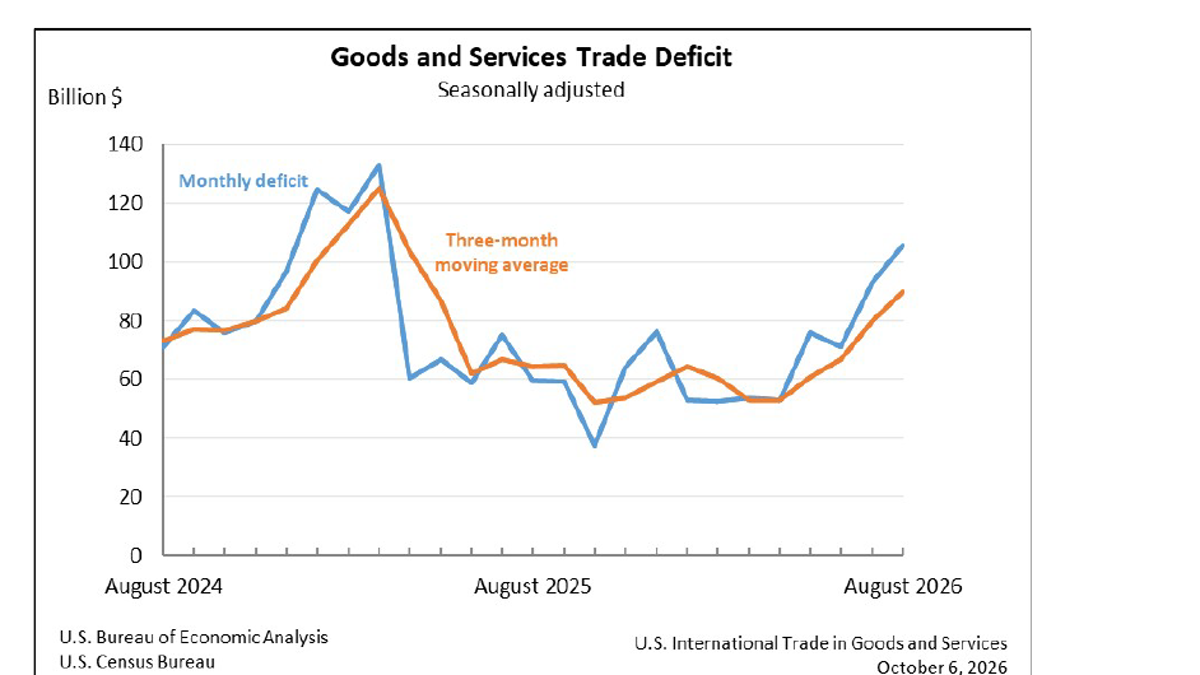
The trade deficit of the United States widened in August. On October 6, the U.S. Census Bureau and the Bureau of Economic Analysis jointly announced that the trade deficit for goods and services amounted to $105.6 billion, an increase of $12.7 billion from $92.8 billion in July after revision, representing a growth of 13.7%. That month, exports were $315.2 billion, up $4.5 billion from the previous month; imports were $420.8 billion, an increase of $17.2 billion. In other words, exports did not decline; the widening deficit was mainly due to faster growth in imports. To describe these figures as "U.S. exports collapsed" would be in direct conflict with the official statistics.
This report reflects cross-border goods and services transactions for August. Although it was released in October, it cannot be considered as an indication of economic activity for that month. The total amount has been seasonally adjusted, but price changes have not been eliminated; the nominal dollar amounts are affected by both quantity and price. More importantly, changes in the monthly deficit do not automatically indicate the state of the economy. An increase in imports of raw materials or equipment by businesses may be related to production plans; changes in energy prices, gold prices, and transportation costs can also contribute to higher amounts. To assess real demand, it is necessary to continue to examine different categories, actual quantities of goods, and subsequent months, rather than drawing a general conclusion based solely on the percentage of the deficit.
The gap in goods supply is widening, while the service surplus remains relatively stable.
Sub-item data shows that in August, the trade deficit in goods expanded by $12.8 billion to $136.6 billion, while the trade surplus in services increased by less than $100 million to about $31 billion. Only by combining these two figures does we get an overall trade deficit of $105.6 billion. The trends in goods and services are opposite: the United States still maintains a large trade surplus in services, while the new gap in goods trade dominated the changes for that month. If one only looks at imports of goods, it is easy to overlook cross-border revenues and expenditures such as intellectual property, business services, tourism, and transportation; however, if one only considers the overall trade deficit, it obscures the underlying structure.
Goods imports increased by $17.2 billion month-on-month to $342.2 billion. According to customs statistics, imports of industrial supplies and materials rose by $9.1 billion, with crude oil increasing by $3.3 billion and non-monetary gold by $3.1 billion; capital goods increased by $6.2 billion, of which semiconductors increased by $2.4 billion, other industrial machinery by $1.3 billion, while computer accessories decreased by $1.6 billion. The simultaneous changes in several major categories indicate that the increase in imports cannot be attributed to a single type of consumer goods. Crude oil and gold are significantly affected by prices and timing of transactions, whereas equipment and semiconductors reflect more of the purchasing arrangements of enterprises. Treating different types of goods as "residents snapping up overseas products" not only does not conform to classification but also does not help in understanding the production chain.
Exports on the export side are also growing. Goods exports increased by $4.4 billion to $205.7 billion; exports of industrial supplies and materials under customs statistics rose by $6.3 billion, with non-monetary gold increasing by $2.3 billion, crude oil by $2 billion, and fuel oil by $1.2 billion. Exports of capital goods increased by $1.3 billion, with semiconductors and computer-related products seeing growth, while civil aircraft exports decreased by $1 billion. Consumer goods exports fell by $2.2 billion, with pharmaceuticals accounting for the reduction of $2.4 billion. Service exports remained relatively stable at around $109.5 billion, with growth in intellectual property royalties and certain commercial services, but travel revenues declined. This combination of figures provides a better indication of where the growth comes from than simply stating that "exports increased by 1.4%" and also suggests that some categories may be subject to significant fluctuations.
The report also provides a separate figure for the actual value of goods after excluding price factors: calculated in 2017 dollars, the actual goods deficit increased by $8.7 billion to $114.7 billion in August, representing a growth of 8.2%; actual goods imports grew by 4.1%, and actual goods exports grew by 1.3%. This is not entirely consistent with the nominal goods deficit growth of 11.1%, indicating that price factors can alter the perceived intensity of changes from the figures. It also shows that there has indeed been an increase in the volume of imports, which cannot be entirely attributed to price changes. The actual figures are specifically for goods only and should not be mistakenly confused with the overall actual deficit of goods plus services.
A single-month gap does not equate to the annual trend, let alone the GDP mechanical deduction.
The official provides a useful comparison: in the first eight months of this year, the trade deficit in goods and services was still 138.2 billion US dollars less than in the same period of 2025, a decrease of 19.9%; cumulative exports increased by 267.7 billion US dollars, and imports increased by 129.5 billion US dollars. The deficit expanded in August, but it is possible for the deficit from the beginning of the year to date to be smaller than last year, as the time periods being compared are different. Looking at the three-month moving average, the average deficit as of August was 89.9 billion US dollars, an increase of 9.9 billion US dollars from the previous three-month period. This indicates that there has indeed been an increase in the deficit recently, but to determine whether this trend will continue, we need to wait for the data from next month, rather than extrapolating a single high value to represent the entire year's result.
The data for July has also been revised. The official figures have increased imports by $4.4 billion and exports by $200 million for July, while there have been smaller revisions to service imports and exports. The difference between August and July must be calculated using the same revised data; otherwise, the year-on-year and month-on-month comparisons will be skewed by the old base figures. For readers following GDP, although the trade balance is related to net exports, the actual net exports in GDP are calculated according to national economic accounting rules, price adjustments, and some special treatments. Therefore, a nominal deficit of $12.7 billion cannot be directly equated with a reduction of $12.7 billion in GDP. The report specifically states that the treatment of non-monetary gold in the national economic accounts is not simply additive to customs import and export records. This is why the impressive figures for individual commodities cannot be mechanically used to estimate macroeconomic growth.
Trade data is also prone to being given too much political significance. This type of data is more suitable for answering economic questions: which products see increased imports, whether exports have also increased simultaneously, whether there has been a change in the service surplus, and whether the nominal amounts match the actual volume of goods. It cannot alone prove the success or failure of a policy, nor can it directly determine the long-term changes in a country's industrial competitiveness. Enterprises may purchase in advance for future production, or they may adjust their book figures due to temporary price fluctuations; it is necessary to consider orders, inventory, and production data together.
The next set of trade data for September is scheduled to be released on November 4th. By then, it will be worth examining whether volatile commodities such as crude oil and gold have seen a decline, whether imports of capital goods continue, whether service exports can grow again, and whether the three-month average deficit continues to widen. Based on current facts, both U.S. exports and imports increased in August, with imports rising more rapidly, and the goods gap contributed to an expansion of the overall deficit; however, the annual cumulative deficit is still lower than the same period last year. Distinguishing between months, categories, and price levels is a more accurate approach to interpreting this official report than simply labeling the deficit as good or bad.