











Key Points
- Dogecoin ( DOGE ) traded at around $0.0770 on Thursday, continuing its rebound for two consecutive trading days.
- Since October 14th, there has been no new capital inflow into the tracking of Dogecoin’s ETF, indicating weak demand from institutions.
- DOGE has once again reached the 50-day moving average on the four-hour chart EMA, currently at around $0.0762, and is approaching the resistance level of the downward trend line near $0.0786.
Dogecoin ( DOGE ) traded at around $0.0770 on Thursday, showing a second consecutive trading day of gains and indicating early signs of a bullish rebound.
This meme coin has remained above $0.0770, continuing the more than 2% rebound from the previous trading day.
However, this round of recovery has not yet attracted significant participation from institutional investors and leveraged traders.
CoinGlass data shows that the open interest of Doge coin futures has been continuously declining since Monday, while the exchange-traded fund (ETF) that tracks this meme coin has not recorded any new capital inflows since October 14th.
Despite weak demand indicators, the four-hour technical structure of DOGE is improving. This cryptocurrency has once again reclaimed a key short-term moving average and is approaching the downward resistance trend line around $0.0786.
If a successful breakthrough occurs, it may enhance the bullish momentum and bring the resistance level of $0.0806 within reach.
Unclosed Dogecoin futures contracts declined as prices rebounded.
The recent rise in the price of Dogecoin has not been accompanied by an increase in participation in the futures market.
According to CoinGlass data, the open interest of DOGE futures contracts dropped to $1.106 billion on Thursday, lower than the $1.18 billion on Monday.
This deviation indicates that this round of rebound has not yet established enough confidence to attract new leveraged positions.
This may also mean that some traders choose to close their positions during the rebound phase, rather than investing more funds.
However, a decrease in open contracts does not necessarily mean bearish sentiment automatically. If shorts are closing their positions, a decline in open contracts could also occur alongside rising prices.
Institutional demand for Dogecoin remains weak as well. According to SoSoValue data, ETF, which focuses on Dogecoin, has not recorded any new capital inflows since October 14th.
The lack of new capital inflows has continued for the third week, indicating limited interest from buyers in these investment products.
For Dogecoin, the insufficient inflow of ETF funds contrasts with the improvement in its short-term price performance.
The rebound of Dogecoin comes as the broader cryptocurrency market attempts to recover from the recent period of high volatility.
After the mid-term elections in the United States, there were signs of improvement in market sentiment, with the Democratic Party gaining control of both houses of Congress.
These political developments have changed the market's expectations regarding the direction of the U.S. economy and digital asset policies.
However, the direct impact on cryptocurrency regulation remains uncertain. For speculative assets such as Dogecoin, broader market confidence may be particularly important.
Dogecoin has once again reclaimed a key moving average on the four-hour chart.
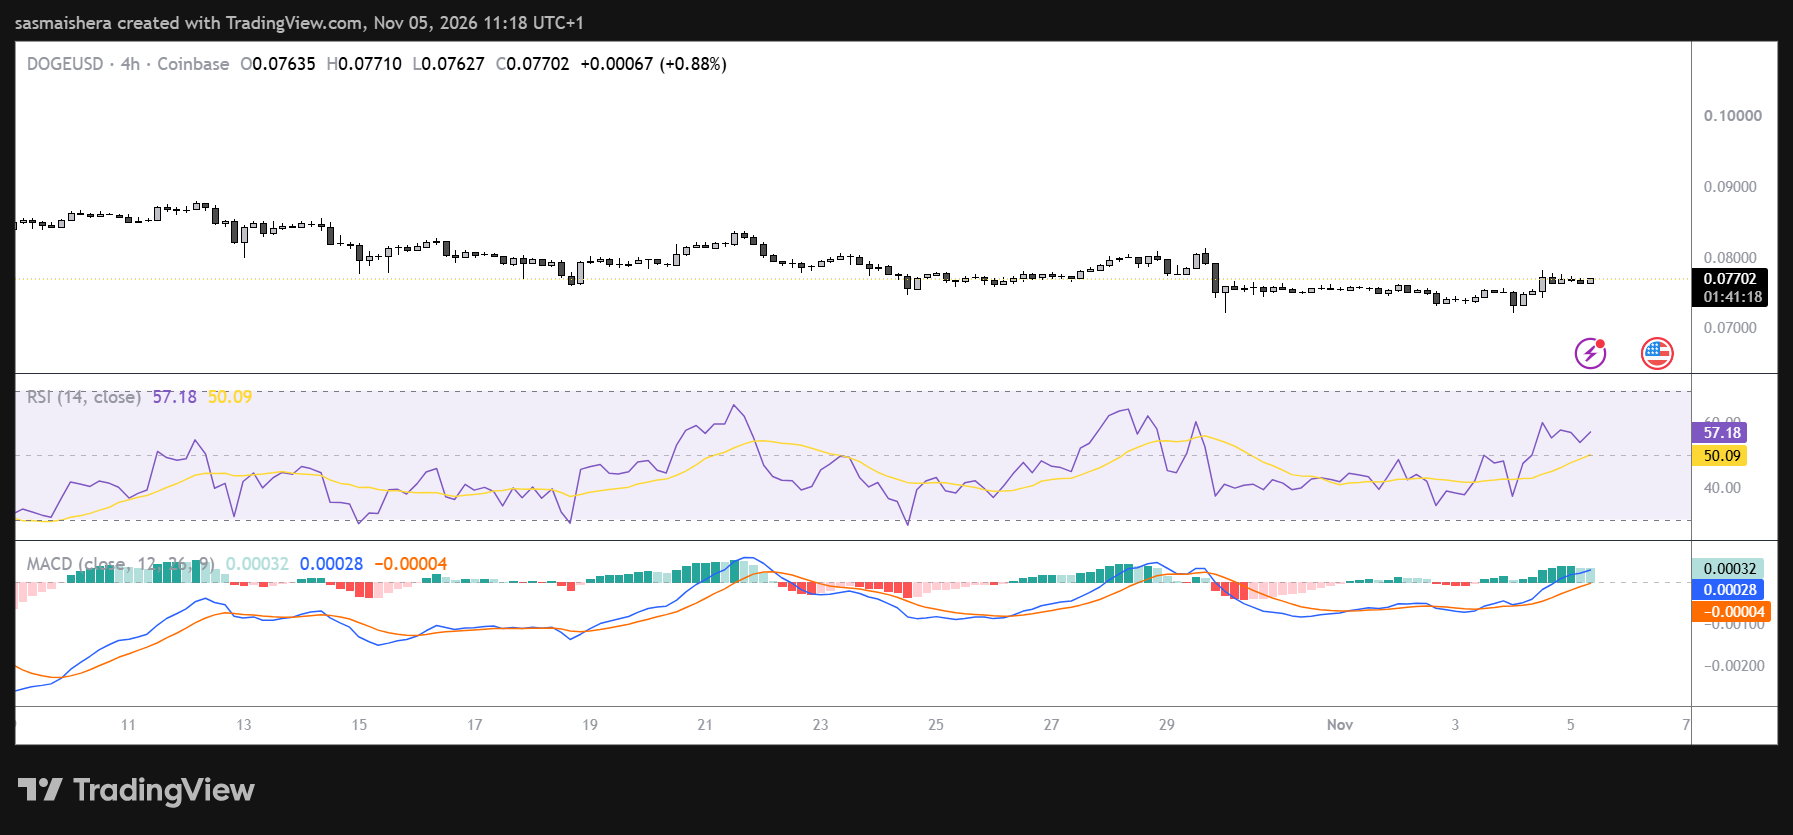
On the four-hour chart, after Dogecoin once again crossed above the 50-period exponential moving average ( EMA ), the technical outlook has improved.
DOGE is currently trading at around $0.0772, above the 50-day moving average of $0.0762 for EMA.
EMA assigns a higher weight to recent prices and is commonly used to determine the short-term market direction.
However, Dogecoin has not yet broken through its most important near-term resistance level. The descending trend line connecting the highs on October 8th and October 29th is currently at around $0.0786.
This trend line has acted as resistance above during the recent decline. If a breakout is confirmed, it will indicate that buyers are challenging a series of lower highs that limit the DOGE rebound.
The momentum indicators on the four-hour chart of Dogecoin also suggest the possibility of further gains.
Relative Strength Index (RSI) at RSI is around 58, indicating an increase in buying pressure. An RSI of 58 suggests that the demand for Dogecoin is improving, but it has not yet entered an extremely overbought range.
Meanwhile, the Moving Average Convergence Divergence indicator ( MACD ) is still slightly positive.
Overall, both RSI and MACD indicate that the rebound of Dogecoin has technical support. However, these signals are still relatively modest and cannot guarantee a sustained breakthrough.
The recent upward target for Dogecoin is the descending resistance trend line around $0.0786.
If it continues to close above this resistance level on the four-hour chart, it may enhance the bullish momentum and create room to move towards $0.0806.
The level of $0.0806 is particularly important as it coincides with the 200-day EMA on the four-hour chart, as well as a horizontal resistance level.
If this trend line cannot be broken through, it may trigger new selling pressure and encourage traders to take profits after a recent rebound.
On the downside, the current support level is around $0.0762 at the 50-day EMA. If this level is continuously broken below, it will weaken the short-term bullish outlook and indicate that buyer momentum is weakening.
The next important support level is around $0.0723, which is a price level that could potentially attract demand again.
If selling pressure intensifies and DOGE breaks below $0.0723, the next downward target will be around $0.0677.