



IBIT of BlackRock experiences outflows of $405.3 million, the largest since June; ETF withdrawal of funds
Coinpaper
1h ago
Ai Focus
Bitcoin ETF IBIT under BlackRock recorded a net outflow of $405.3 million on November 2, the largest single-day outflow since June. US spot Bitcoin ETF saw a total net outflow of approximately $1.04 billion over two consecutive trading days, and BTC fell by about 2% in the past 24 hours, once approaching $76,500.
Helpful
No.Help

Key Points

  • Bitcoin ETF under BlackRock recorded a capital outflow of $405.3 million on November 2nd.
  • US spot Bitcoin ETF saw a total net outflow of approximately $1.04 billion over two consecutive trading days.
  • BTC fell by about 2% in the past 24 hours, once approaching $76,500

The fund experienced its largest single-day outflow since June, which further exacerbated market concerns about weakening institutional demand, as Bitcoin ( BTC ) struggled to hold above the $77,000 level.

According to the data from Farside Investors, BlackRock's IBIT recorded a net outflow of $405.3 million, while Fidelity's Wise Origin Bitcoin Fund ( FBTC ) attracted a net inflow of $6.7 million. No other funds experienced either net inflow or net outflow.

Bitcoin ETF Capital Flow
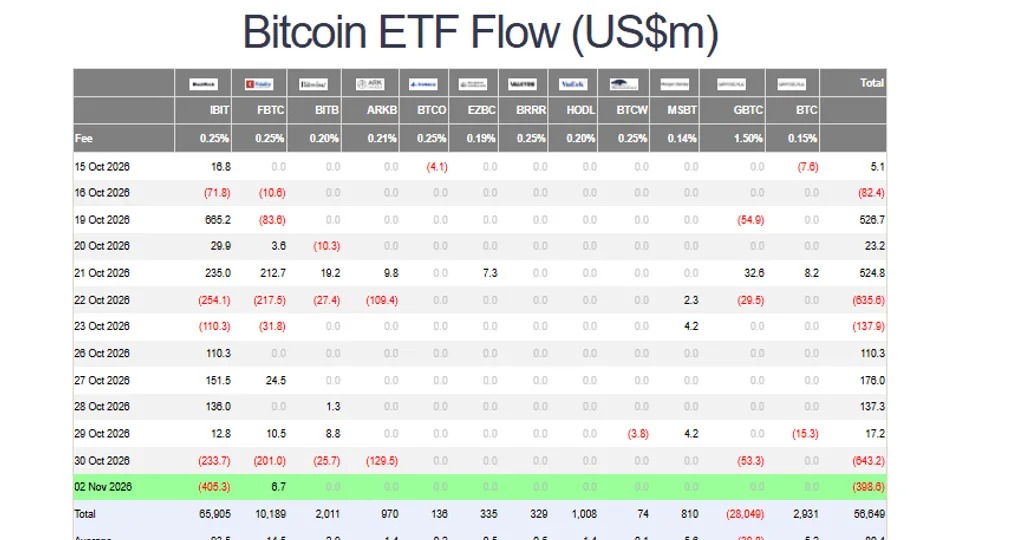
On Monday, a capital outflow of $405.3 million from IBIT represented the largest single-day outflow for the fund since June, and it marked a clear reversal from its recent trend of continuous net inflows.

Meanwhile, the US spot Bitcoin ETF market recorded a net outflow of approximately $1.04 billion during the same period, erasing the positive momentum established in the last week of October.

On Friday, a total of $643.3 million was withdrawn by ETF, which is also the largest single-day outflow in the industry since June 25th.

Bitcoin price falls below $77,000

Within the past 24 hours, the price of Bitcoin has also come under pressure. This leading cryptocurrency has fallen by about 2%, breaking through the psychologically significant level of $77,000.

During the morning trading on Tuesday, BTC approached $76,600 at one point, after having fallen from above $78,000 during Monday's trading session. The cryptocurrency briefly neared $76,500.

The pressure is not limited to cryptocurrencies. Tech stocks are also facing selling pressure, and the uncertainty surrounding the U.S. mid-term elections on November 3 has also intensified market caution.

Currently, the direct support level for Bitcoin is around $76,500. If it continues to fall below this level, it may further drop to $75,000. On the other hand, if it manages to rebound above $78,000, it could help stabilize market sentiment and provide an opportunity for buyers to regain momentum.

Overall, the combination of large-scale outflows of ETF funds and the decline in Bitcoin prices indicates that institutional demand is still under pressure. Investors will continue to watch whether the IBIT of BlackRock can reverse the recent outflow trend.

Tip
$0
Like
0
Save
0
Views 40
CoinMeta reminds readers to view blockchain rationally, stay aware of risks, and beware of virtual token issuance and speculation. All content on this site represents market information or related viewpoints only and does not constitute any form of investment advice. If you find sensitive content, please click“Report”,and we will handle it promptly。
Submit
Comment 0
Hot
Latest
No comments yet. Be the first!
Related
Apple shares fall more than 4% ahead of the earnings report; Ternus's first-quarter profit margin forecast falls short of expectations during their tenure
Apple's stock price fell by about 4.4% before opening on Tuesday to around $323.61 due to profit margin forecasts that were lower than market expectations. The company's revenue for the fourth fiscal quarter exceeded expectations, but iPad sales did not meet estimates. This is Apple's first financial report since John Ternus took over from Tim Cook as CEO in September. Ternus stated that despite supply constraints and exchange rate pressures, this was still Apple's best fiscal year on record.
Coinpedia
·2026-11-03 18:54:07
5
Ping An Securities: Actively Promoting the Implementation of Swap Facilitation Services, Full of Confidence in the Long-Term Development of the Capital Market
On November 2, the People's Bank of China announced that it would carry out the third Securities, Funds, and Insurance Companies Swap Facility (SFISF) operation on November 3, with a term of one year and the possibility of extension depending on circumstances. Currently, 31 securities and fund companies have declared their interest, with a total intended application amount exceeding 100 billion yuan. Ping An Securities stated that the company has established a special working group to advance related business and indicated that it will use the swap facility financing quota in batches, increasing the allocation of equity assets such as stocks and stock (ETF).
The Block
·2026-11-03 18:54:03
5
Apple Stock Price Outlook: Can AAPL Rise After Q4 Earnings Report?
Apple reported revenue of $114.5 billion in the fourth quarter of fiscal year 2026, a year-on-year increase of 12%, exceeding analysts' expectations; iPhone and Mac had strong sales, but the guidance for gross margin in the December quarter and rising memory costs have raised concerns among investors.
Coinpedia
·2026-11-03 18:53:59
5
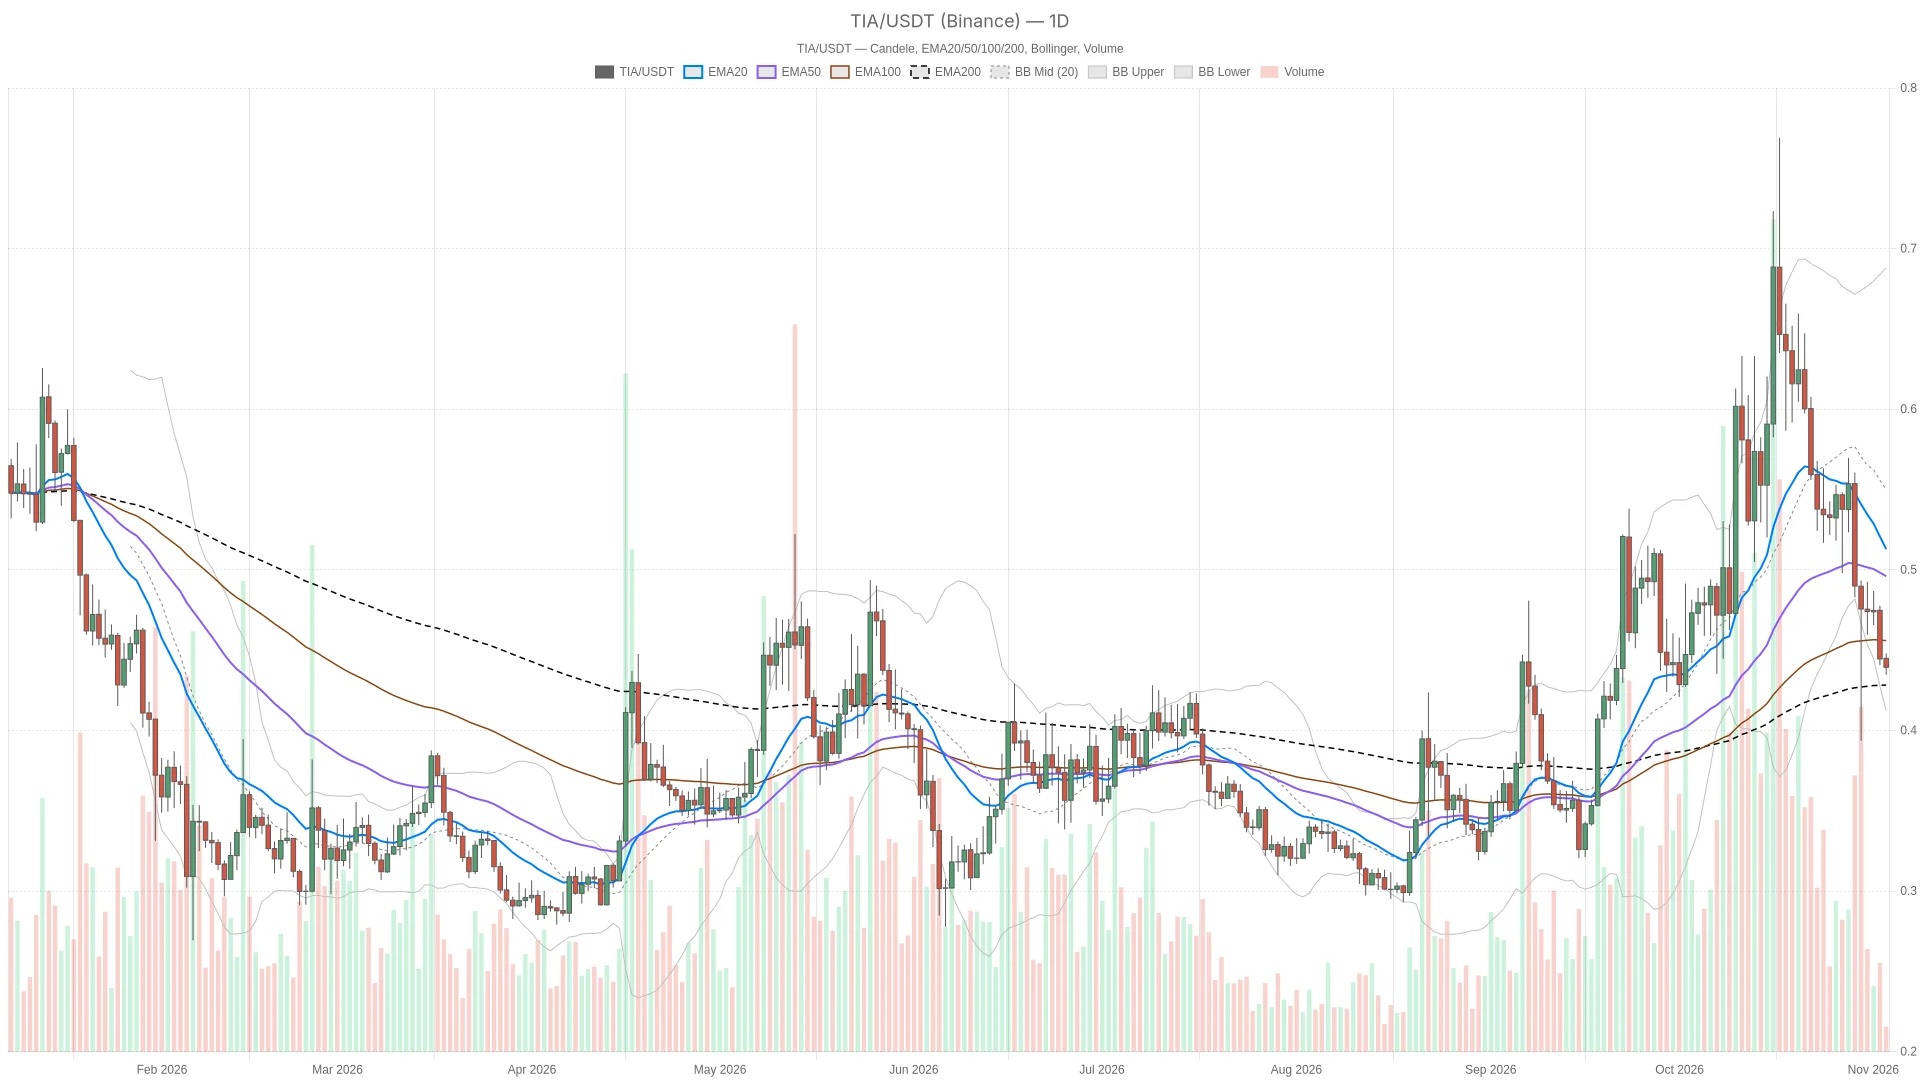
Celestia Price Daily Line Structure is Neutral
As of November 3, 2026, Celestia ( TIA ) is trading at $0.4393 on Binance. The daily chart pattern is neutral with a defensive tendency: the price is still above the daily EMA200, but below the daily EMA20 and EMA50. At the hourly level, RSI is in an oversold zone, however, a reversal on the daily chart RSI has not yet been confirmed; for a stronger recovery, the daily close needs to exceed the $0.4542 pivot point.
The Cryptonomist
·2026-11-03 18:43:36
8
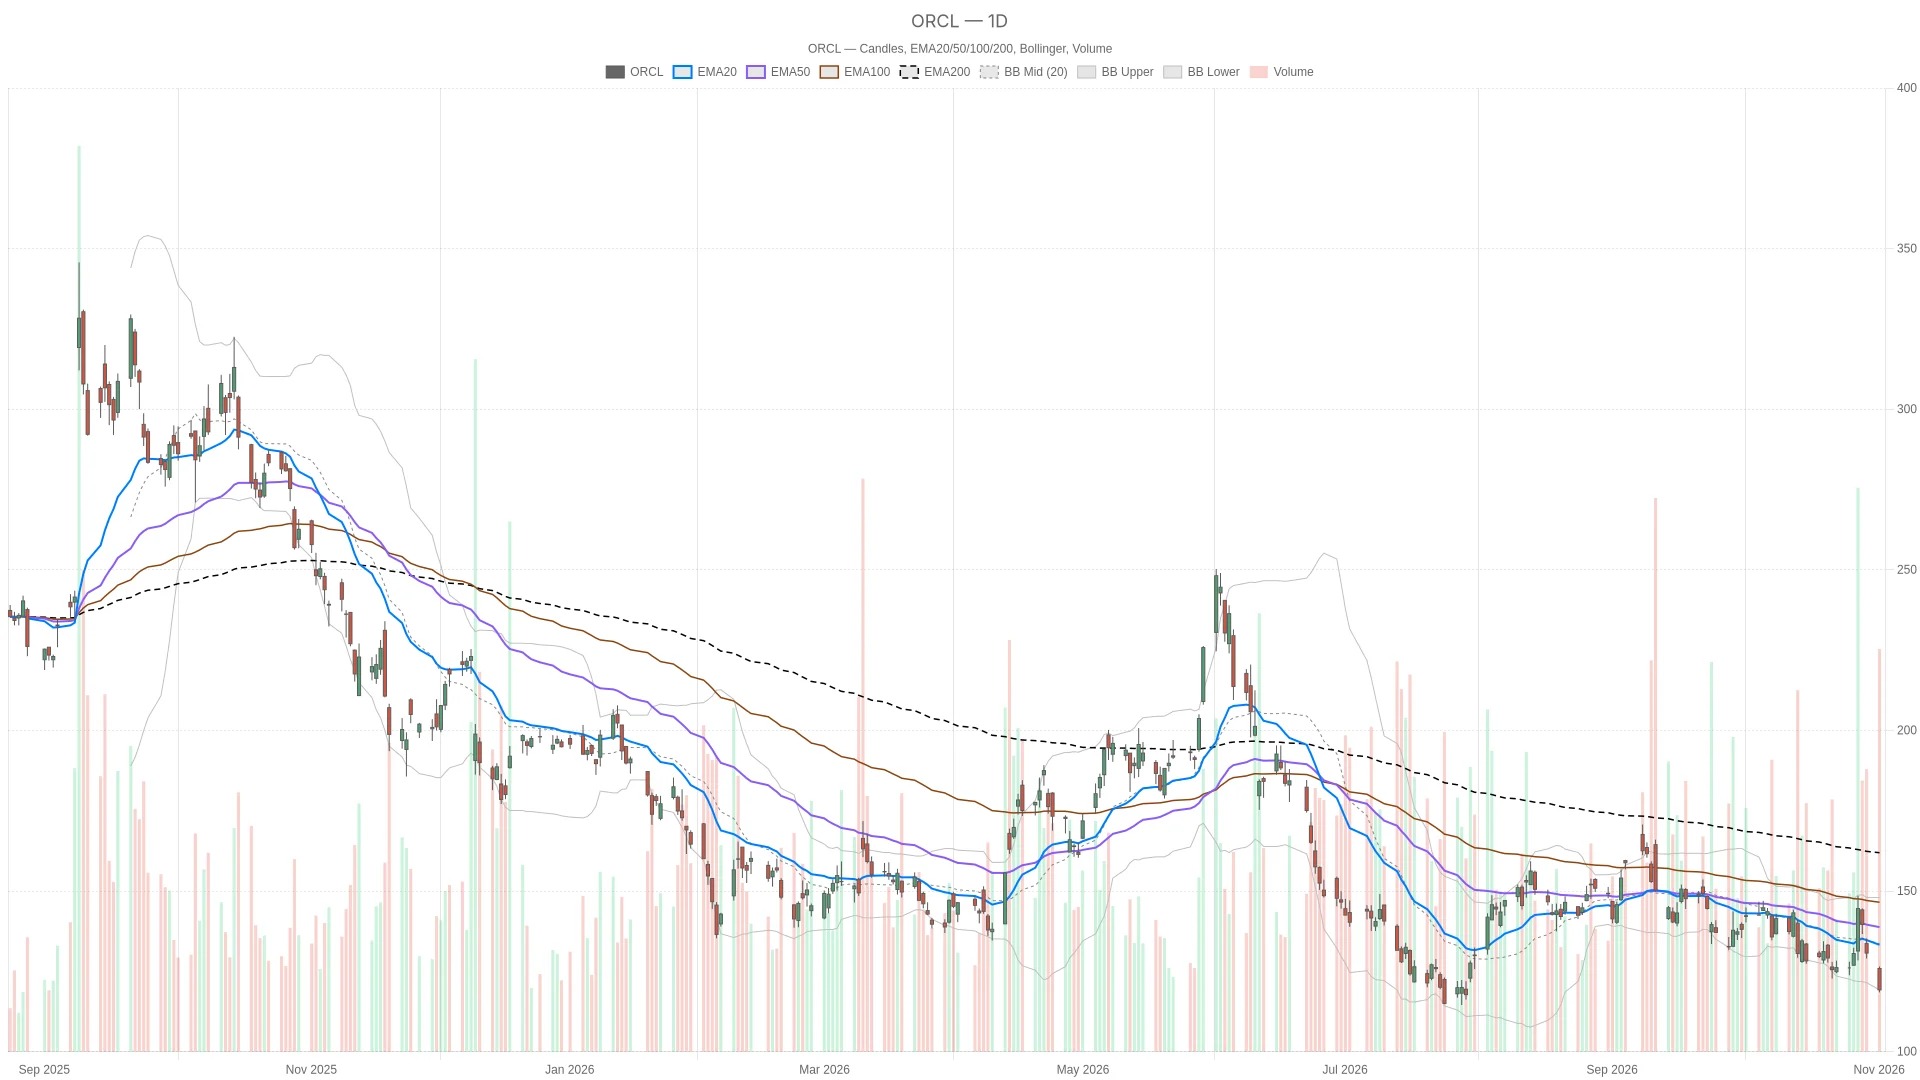
Oracle's stock price drops 8.76% to $119.22, with bearish signals dominating the daily chart
Oracle's stock price closed at $119.22 on Monday, down from the previous close of $130.67. The daily chart structure is bearish, with the closing price below all three moving averages and close to the lower band of the Bollinger Bands. Although a positive MACD bar chart appears on the 15-minute chart, the hourly chart remains oversold but still in a bearish state.
The Cryptonomist
·2026-11-03 18:43:32
8
View More