

As of October 14, Microsoft (MSFT) closed at $543.45, after touching $551.15 intraday, just about $2.5 below its all-time high of $553.72 set in October 2025. Its market cap returned to $4.04 trillion. Six months ago, the stock fell below $350, and it has since rebounded over 50%. At $551, Azure growth reaccelerated to 43%, and paid Copilot seats surpassed 30 million, with fundamentals and the stock price strengthening in tandem. But RSI is approaching 68, near overbought territory. Breakout or pullback?
Table: Microsoft Latest Key Data Summary
| Data Item | Latest Value |
|---|---|
| Closing Price | $543.45 |
| Daily Range | $543.06 – $551.15 |
| Market Cap | $4.04 Trillion |
| P/E Ratio (TTM) | 30.28x |
| Forward P/E | 27.50x |
| EPS (TTM) | $17.95 |
| 52-Week Range | $349.20 – $553.72 |
| Trading Volume | 23,647,907 shares |
| Forward Dividend & Yield | $3.92 (0.72%) |
| Analyst Average Target Price | $589.60 |
Note: The above content is compiled and summarized by CoinMeta based on public market data. Please refer to actual data if there are any fluctuations.
Can Azure and Copilot Dual Engines Push Microsoft Stock to a New High?
The core support for Microsoft's intraday $551, just $2.5 from a new high, in our view, comes from the dual narrative of Azure's accelerating growth and Copilot's commercialization.
Azure Growth Rebounds Above Expectations
Azure's rebound is the primary reason Microsoft stock regained confidence. In Q4 FY2026 (ended June), Azure and other cloud services revenue grew 43% year-over-year, up from 40% in the previous quarter. This indicates accelerating growth and marks the fastest quarterly growth since early 2022. Azure's full-year revenue exceeded $100 billion for the first time. Management guided for about 45% growth at constant currency next quarter. In addition, Microsoft's AI business annualized revenue grew 123% year-over-year. AI demand is still rapidly converting into revenue.
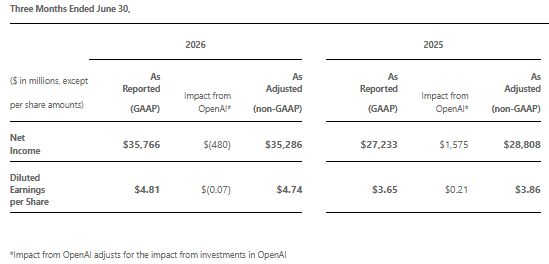
Image: Microsoft Latest Earnings
Copilot Business Model
In our view, the upgrade of Copilot's business model is equally critical. As of Q4, M365 Copilot paid seats surpassed 30 million. Net seat additions doubled quarter-over-quarter. The number of large customers with over 50,000 seats grew more than 7x year-over-year. More importantly, the billing logic has changed, from fixed packages to a hybrid "seat plus usage" model. Cowork now supports usage-based charging. Revenue can automatically expand as users increase usage frequency.
From the above analysis, we believe Microsoft's most underappreciated change is not the growth number, but the revenue model itself. This means the same user base can deliver sustained growth as usage depth increases.
$553-$555 Resistance Band: Breakout or Pullback for Microsoft Stock?
The $553-$555 range is Microsoft's most important technical resistance band over the past year. In October 2025, Microsoft formed a double-top pattern in this area and then entered a half-year correction, hitting a low of about $349 in June. The current price is just a step away from this resistance band, and technical signals have diverged.
Diverging Technical Indicators
According to the latest data from Bijiie.com's US stock section, Microsoft's RSI is approaching overbought and volume momentum is weakening marginally. We speculate that Microsoft stock may see a short-term pullback.
Microsoft's RSI has risen to about 68-70, approaching overbought territory, and weakening volume suggests slowing upward momentum. A bearish pin bar pattern appeared near $545.80 on the 5-hour chart, often signaling a possible short-term reversal. If the price breaks below the 20-day moving average, downside support is seen at $513 or even $487.
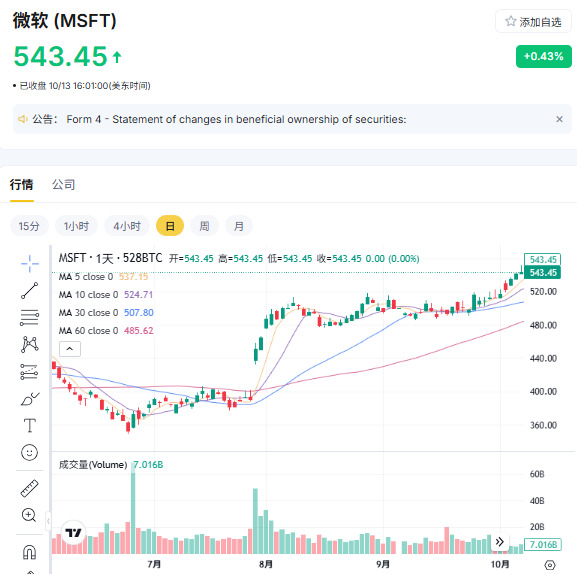
Image: Microsoft Stock Trend
The $530-$550 range is a "no-trade" consolidation zone. We recommend waiting for a decisive breakout above $555 or a pullback to support before acting, for a better risk-reward ratio.
Where Are the Key Support and Resistance Levels?
According to Bijiie.com's real-time US stock candlestick chart, we analyze that Microsoft's current key support is at $527-$530, and key resistance is at $553-$555.
If it breaks above $555 with volume and holds, it could open a new round of upside. If it is rejected again and pulls back, it could replicate the October 2025 double-top correction path. According to options market data, strike prices are dense near $550, which could amplify short-term volatility. Our view is that a breakout requires volume confirmation, while a pullback requires watching whether the $530 support holds. It is not advisable to blindly chase highs in the resistance band, nor to be overly bearish before support breaks.
How Much Upside Room Does Microsoft Stock Valuation Have?
Wall Street institutions have recently aggressively raised Microsoft price targets, reflecting a repricing of AI monetization prospects. According to a FactSet survey, the average target price from 59 institutions is $584.48, implying about 6% upside. Below is our key summary:
| Institution | Previous Target | New Target | Adjustment |
|---|---|---|---|
| Barclays | $512 | $600 | +$88 |
| Deutsche Bank | $550 | $600 | +$50 |
| Scotiabank | $510 | $615 | +$105 |
| Melius | Hold | Buy, $665 | Rating Upgrade |
From the table above, we can analyze that institutional target prices are concentrated in the $600-$615 range, a consensus rather than isolated cases. This also shows that market confidence in Microsoft's AI monetization path has shifted from "wait-and-see" to "confirmed."
Can $175 Billion in Capex Continue to Deliver Returns?
In our view, the biggest bull-bear divergence around Microsoft is its capex plan.
Management provided FY2027 capex guidance of about $175 billion. This is the largest annual capital expenditure by a single company in history. But note, this is not all cash outflow. Microsoft extended the useful life of data centers and office buildings from 15 years to 25 years. More leases shifted from finance leases to operating leases. These are not included in capex. The market once cheered the "drop from $190 billion to $175 billion." But real investment has not decreased.
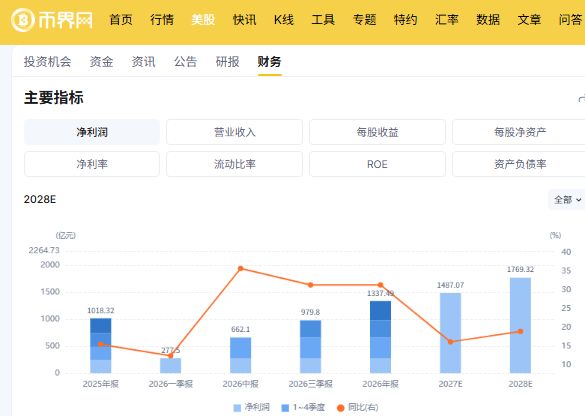
Image: Microsoft Net Income
Microsoft CEO Nadella responded to this. He said the $175 billion is for thousands of customers, not to serve two or three anchor model companies. He also noted that Meta and Google spend twice as much as Microsoft. Microsoft is also the only one of the four cloud giants whose annual free cash flow has not yet turned negative.
Our view is: the absolute amount of capex is not the core issue. Capital conversion efficiency is. Microsoft's ability to quickly monetize newly added computing power each quarter is the key dividing line between it and other cash-burning giants.
Microsoft Stock Price FAQ
Q1: Is there a high probability Microsoft breaks $555?
The probability is relatively high but requires volume confirmation. The current stock price is firmly above the 20-day, 50-day, and 200-day moving averages, MACD remains bullish, Azure growth guidance of 44%-45% is above market expectations of about 41%, and the average institutional target price is $584-$588. Although RSI at about 68 is near overbought, it has not reached extreme levels. If volume expands in support, the probability of a breakout is higher than a pullback.
Q2: Can Azure growth continue to rise?
Yes, but the magnitude depends on computing power supply. Azure Q4 growth of 43% was the fastest since early 2022, and management guided about 45% for Q1. New data centers and GPU capacity are gradually coming online, and customer demand previously constrained by computing power is beginning to convert into revenue. If supply keeps up, growth exceeding 45% is not impossible.
Q3: Will Copilot revenue exceed expectations?
There is room to exceed expectations. Paid seats surpassed 30 million, with over 10 million net additions in a single quarter. Cowork has adopted the usage-based Copilot Credits model, at 1 cent per credit. This means revenue no longer depends only on seat additions; increased usage depth among existing users can bring sustained growth, giving revenue elasticity greater than linear market extrapolation.
Conclusion
Microsoft's latest stock price is $543.45, with an intraday high of $551, just $2.5 from a new high. The key to a breakout is not $551 itself, but whether $555 can be held with volume. Azure Q1 growth guidance of 44%-45% and Copilot's usage-based billing model are the underlying variables determining direction. If the Q1 earnings on October 28 validate these two data points, $551 is a launchpad; if they fall short, the $530 support will be tested.
Disclaimer: Readers are strictly advised to comply with local laws and regulations. This article is compiled based on public market data for reference and educational purposes only, and does not constitute investment advice. Follow CoinMeta for the latest updates.