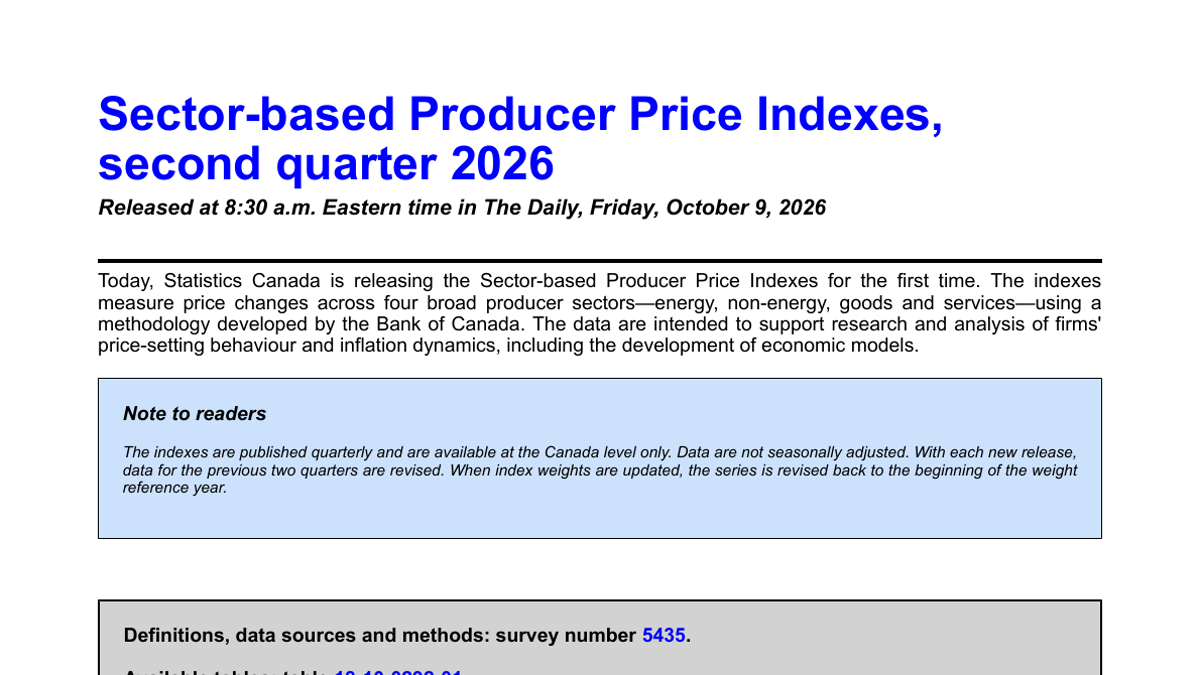
People who study inflation often wonder whether price pressures first hit energy companies, other commodity producers, or service providers. The Consumer Price Index (CPI) shows how much households spend on goods, while the traditional Industrial Product Price Index (IPI) only covers a portion of the production process; therefore, they may not be able to reflect the price changes across all sectors of businesses. On October 9th, Statistics Canada released for the first time the “Producer Price Index by Sector,” which categorizes producers into four main groups: energy, non-energy, commodities, and services. This is the launch of a new statistical tool, not an announcement by the central bank regarding new interest rate decisions, and one should not draw the conclusion that inflation has turned just because it is being released for the first time.
According to official statements, this quarterly index utilizes a methodology developed by the Bank of Canada, with the aim of enabling researchers to analyze corporate pricing behavior and inflation transmission. The first release corresponds to the second quarter of 2026, covering the national level without providing provincial breakdowns, and no seasonal adjustments have been made. The latter two points are crucial: attempting to infer the individual trends of Toronto or Alberta using a national average, or treating the raw quarterly changes as a continuous trend after seasonal adjustment, would exceed the range supported by the data itself. For the market, what is most valuable about this set of data is not any single figure, but whether stable and comparable price chains can be established for future quarters.
Looking at each of the four departments separately, which old indicators that were difficult to answer can now be addressed?
What distinguishes energy from non-energy is the source of price shocks; what distinguishes goods from services is the form of production and delivery. Energy prices tend to rise and fall quickly, which can drive nominal prices and can also obscure slower changes in other sectors. Goods companies may first feel the impact on raw material and transportation costs, while the cost structure of service companies depends more on wages, rent, and professional inputs. Only by observing them within the same statistical framework do researchers have the opportunity to determine whether price pressures are concentrated in a few volatile items or gradually spread to a broader range of economic activities.
However, clear grouping does not necessarily equate to a clear causal relationship. The energy index rising first, followed by the service index, may reflect cost transmission, or it could also occur simultaneously with changes in demand, wage agreements, taxes and fees, or industry restructuring. The new index provides a better window for observation, but it does not automatically prove that companies are passing on every penny of cost to their customers. Economists still need to consider it in conjunction with industrial product prices, wages, consumer prices, import prices, and corporate surveys, taking into account the different statistical frequencies and coverage areas of each.
The Canadian Statistics Agency also made it clear that this set of data is currently released quarterly, and with each new release, the data for the first two quarters is revised. When the weights are updated, the series can be retrospectively revised back to the beginning of the base year for those weights. This means that the historical charts seen on the website today are not the permanently fixed “final answers.” If research institutions use the initial values to build predictive models, they must keep track of the versions used, to avoid mistaking the revised figures for information that was actually available at the time. News reports should also indicate the date of release and the methodology used, and should not refer to revised figures from several months later as if the market had already “seen” those same signals at that time.
There are still several layers between new indicators and the actual experiences of consumers. The prices at which companies sell their products can be reshaped by wholesalers, retailers, taxes, and discounts; the same cost changes may be absorbed by corporate profits in highly competitive industries, while in industries with tight supply, they are more likely to be reflected in the final retail prices. As a result, production-side indicators serve as a kind of pressure gauge, but they are not direct replicas of household bills. They can help observe the upstream factors of inflation, but they cannot replace the final price data for housing, food, or service consumption.
The significance for interest rates and corporate decision-making depends on several subsequent periods in the future, rather than just the initial headline.
The Bank of Canada is concerned about price stability, but the official release does not describe this new index as an independent policy trigger. The central bank's decisions also take into account demand, employment, wages, inflation expectations, and financial conditions. If energy prices surge in one quarter rather than remaining stable in the energy sector, the policy implications are different from a continuous increase in prices across all sectors; if increases in service prices are due to changes in statistical weights, they should not be interpreted as new wage pressures. To directly translate a new piece of data into "an inevitable interest rate hike or cut at the next meeting" is an unfounded leap.
For enterprises, four types of indices may provide more appropriate references for contract adjustments. When purchasers negotiate long-term prices with suppliers, they should not use a single overarching CPI to cover all costs; energy-intensive enterprises and service outsourcing companies face different risks. However, the national scope of these indices may not match the specific purchasing baskets of individual enterprises, and the raw data is not seasonally adjusted. If contracts are mechanically applied to single-quarter changes, this could lead to price fluctuations that neither party anticipated. A more prudent approach is to clarify the series used, the base period, the revision rules, and the adjustment cycle.
The first thing to be wary of is the illusion that "new indicators equal new facts." The Canadian economy has had production-side prices in the past; it's just that researchers have lacked a comprehensive observation panel that spans four sectors and is organized using a unified method. The release of this data provides additional material for future analysis, but there hasn't been enough time to accumulate sufficient data over multiple periods to assess stability, let alone claim that a certain type of pressure is permanently declining. Readers can view this release as the addition of four new "dashboards" to the economic monitoring system: they are worth keeping an eye on regularly, but the readings should be interpreted in conjunction with other indicators, revised explanations, and actual business results.
When using this index for the first time, it is also important to pay attention to the base period and weights. The index points do not represent the actual transaction prices of any particular commodity or service, and the level of these points does not indicate which industry is more expensive; what is truly comparable is the change in the same series under the same definitions. The weights of different sectors determine which sectors have a greater impact on the overall total, and these weights may change with economic restructuring. If reports only highlight the sectors that have risen the fastest, ignoring their share in the overall picture, readers may misinterpret these localized increases as a general price rise across all production sectors. The statistical bureau has indicated that there will be a revision mechanism in the future, which underscores the importance of continuous observation over rushing to draw initial conclusions.