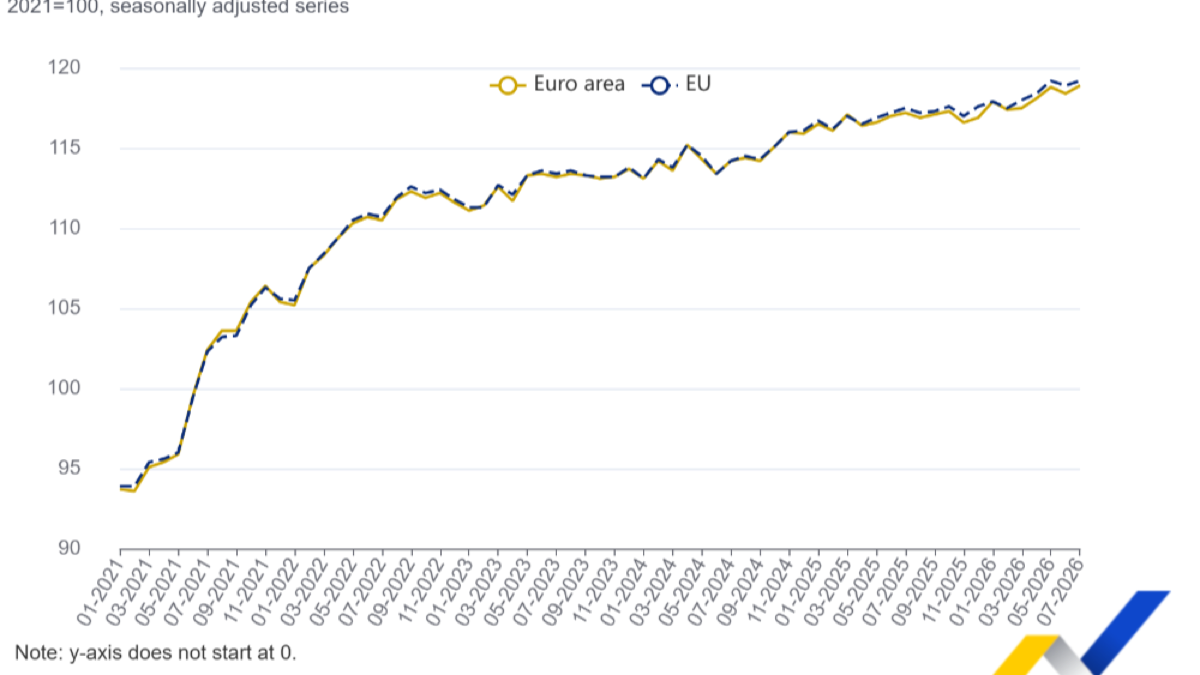
Apart from manufacturing data and inflation news, service sector output is more closely related to the daily work of many people. Preliminary data released by the European Union Statistics Office on October 7th indicated that in July 2026, service sector output in the eurozone increased by 0.4% month-on-month, and across the EU by 0.3%; both had decreased by 0.3% the previous month. On a year-on-year basis, both the eurozone and the EU saw growth of 1.5%. This is a sign of recovery, but a single month of positive growth does not mean that the service sector has entered a phase of sustained acceleration, nor can it directly lead to conclusions about the next interest rate decision.
It is worth clarifying the statistical methodology first. The "service industry output" mentioned here is an indicator that measures the changes in production volume of related service industries on a monthly basis, excluding finance and public services; the month-over-month figures are seasonally adjusted, while the year-over-year figures are calendar-adjusted. If there are gaps in data from member countries recently, estimates will be used during the consolidation process. In other words, this does not represent how much money consumers spent in that month, nor does it cover all service activities. To equate this output index with service industry sales or the number of employed people would be to confuse completely different economic variables.
A rebound in total volume does not mean that every counter and office is busier.
In the segmented industries, professional, scientific, and technical activities in the eurozone increased by 1.1% month-on-month in July, real estate activities grew by 0.7%, accommodation and catering by 0.6%, information and communications by 0.4%, and administrative support by 0.3%; however, transportation and warehousing saw a decrease of 0.1%. These trends indicate that changes in overall volume may stem from a combination of different sectors, rather than a simultaneous rebound across all industries. If companies are preparing budgets for the coming months, they should first consider their own industry and customer base, before taking into account how much reference the regional average can provide.
The year-on-year figures are also not completely consistent. In the eurozone, information and communication services increased by 3.1% compared to July of the previous year, transportation and warehousing by 1.5%, while accommodation and catering only increased by 0.8%. The latter two sectors are affected by the tourist season, transportation arrangements, and cost changes, so there may be significant fluctuations from month to month. The demand for professional services may be related to corporate investment and outsourcing plans. Based on a single month's year-on-year comparison, it is impossible to determine which of these factors represents a persistent trend; however, by considering both the monthly and annual trends, we can avoid mistaking short-term rebounds for a return to a stronger growth trajectory for the entire industry.
The differences between countries are even greater. Among the member states for which data is available, Luxembourg saw a growth rate of 7.6% that month, Greece 5.1%, and Sweden 1.5%; on the other hand, Hungary experienced a decline of 4.5%, Denmark 3.1%, and Slovenia 2.7%. Due to differences in country size, industry structure, and base levels, extreme figures should not be directly used to evaluate the success or failure of policies. The average figure for the Eurozone can reflect the overall trend, but a cross-border business needs to consider its target markets and its own customer base; an increase in regional totals may also contradict the reality of the country in which it operates.
For example, an online service provider serving multiple European countries may derive more of its revenue from information and communications technology as well as professional services, rather than local dining activities; during the same period, a logistics company may observe a slight decline in transportation and warehousing operations. Both companies operate in the “service industry,” yet their perceptions of a 0.4% overall growth rate could be vastly different. While the overall index is suitable for determining whether the economy as a whole has recovered, industry-specific data is more closely related to changes in orders. If analysis merely mentions “the recovery of Europe’s service industry” without specifying which sectors are growing and which are still under pressure, the most valuable information is overlooked.
When interpreting charts, it is also important to pay attention to the baseline and revisions. The index from the European Union Statistics Office uses 2021 as a base of 100. While the chart lines show how output levels have changed in recent years, one should not overemphasize each small fluctuation just because the vertical axis does not start at zero. The statistics office has also revised previous data: the month-on-month decline in the EU in June was changed from 0.2% to 0.3%, and the year-on-year increase in the eurozone in June was changed from 1.5% to 1.3%. Revisions are a normal part of short-term statistics and also serve as a reminder to the market not to assign too much certainty to the first decimal place of the figures.
For enterprises and the market, the next step is to focus on continuity.
For macro-level judgment, service industry output can be considered alongside purchasing manager surveys, retail activities, employment, and wages. However, these indicators measure different things. Surveys reflect the perceptions or trends of respondents, while output indices attempt to measure the actual volume of activity. Labor force data tells us whether companies are expanding or reducing their workforce. If several types of data point in the same direction for several months in a row, the trend judgment becomes more confident; if they conflict with each other, it is necessary to further investigate factors such as prices, working hours, seasonality, and the statistical coverage, rather than simply choosing the figure that best fits expectations.
For service companies, a total growth of 0.4% cannot directly translate into revenue forecasts. Even if output increases, pricing power, wage costs, and rent can eat into profits; even if the overall regional growth is modest, certain niche markets can still experience growth. This is especially true for information and communications technology as well as professional services, where demand often varies with corporate capital expenditures and the pace of project delivery. A more practical approach for operators is to use official data as a reference point while also monitoring their own company's orders, contract renewals, average transaction value per customer, and payment collection cycles. Macroeconomic indicators provide a framework, but they do not create budgets on behalf of businesses.
Interest rate trading also requires avoiding mechanical inference. Strong service industry activity may indicate demand resilience, but it could also coexist with price pressures and changes in productivity; weaker data does not necessarily lead to immediate interest rate cuts. Central banks are concerned about medium-term inflation and the overall economic outlook, and the service industry data released in July, which was delayed, is just one piece of the puzzle. To interpret a "month-on-month rebound" as a "confirmed policy shift" goes beyond what the data can prove.
For ordinary readers, it is more practical to include the publication date in the judgment: what is seen in October may be related to activities from July, during which time the company has already experienced new orders, price changes, and financing conditions. Current business decisions can refer to this statistics, but one should not pretend that it represents a real-time economic thermometer. If subsequent surveys or corporate financial reports show significantly different directions, one should first check the industries covered and the timing of the surveys before deciding which piece of evidence is more relevant to the current issues. The accuracy of macroeconomic news often depends on these seemingly minor time labels.
As of the time of publication, it can be confirmed that service sector output in the eurozone and the EU has made a slight recovery after a decline in June, and remains positive on a year-on-year basis; however, there is a divergence in performance across industries and member states, and the figures are preliminary estimates that may be revised. The next similar release is scheduled for November 9th. By then, what will be most noteworthy is not only the new overall growth rate but also whether sectors such as transportation, accommodation and catering, information and communications, and professional services will continue to show the same trend. If the rebound only lasts for one month, its significance will be completely different from a continuous improvement.