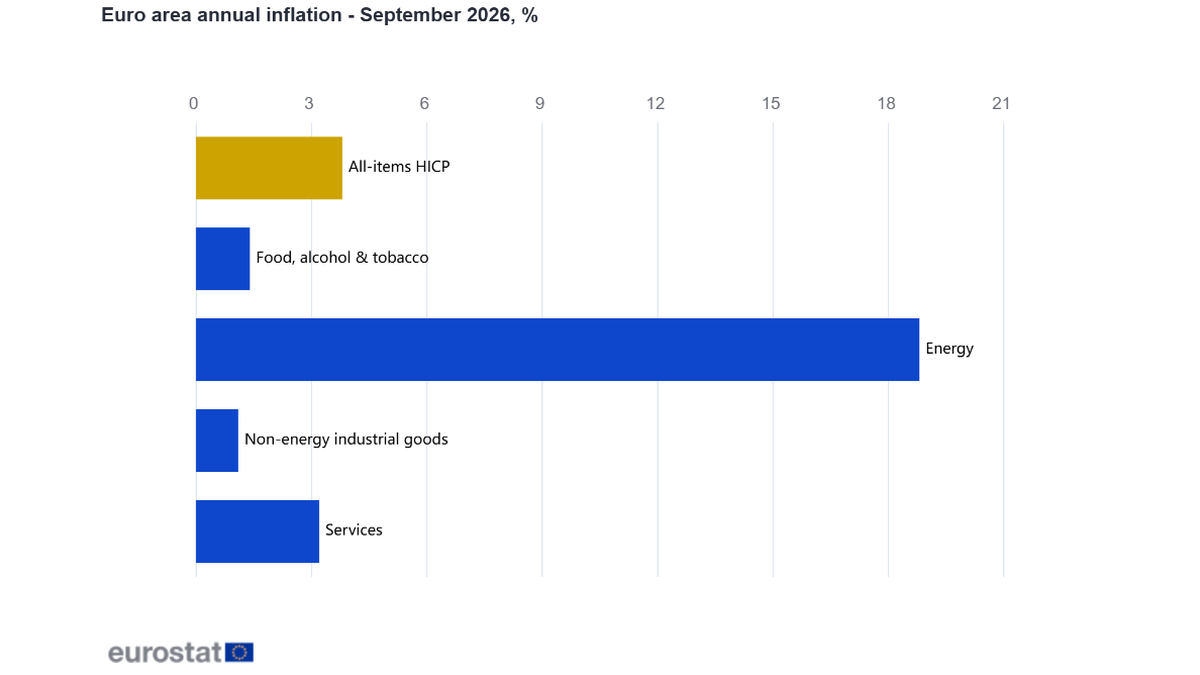
In September, inflation rates in the eurozone rose further. According to a preliminary estimate released by the European Union Statistics Office on October 2nd, the Harmonized Index of Consumer Prices (HICP) in the eurozone increased by 3.8% year-on-year, up from 3.2% in August; energy prices rose by 18.8% year-on-year, compared to 14.3% in August. These two figures together indicate the main driving forces behind this round of inflationary surge, but they cannot be directly interpreted as meaning that "all goods are experiencing price increases of nearly 40% or 20%." This data is preliminary, with the full September figures scheduled to be released on October 16th.
The European Union Statistics Office puts goods and services under a unified HICP framework, which allows for the comparison of prices across different member states. Year-on-year comparisons are made against the same month of the previous year, while month-on-month comparisons are made against the previous month: in September, the overall index initially estimated a month-on-month increase of 0.6%, with energy costs increasing by 3.9%. The high year-on-year figures are related not only to the prices of that month but also to the base level from the same period last year. To determine the extent of new shocks faced by residents, one cannot rely solely on the year-on-year percentage; it is more important to look at the actual changes in energy bills and whether these impacts have been transmitted to transportation, food, and services.
Energy has the most noticeable impact, while services and core indicators still need to be observed separately.
Looking at each category separately, energy saw a year-on-year increase of 18.8% in September, which is 4.5 percentage points higher than in August; services increased by 3.2% year-on-year, a slight rebound from 3.0% in August; food, alcohol, and tobacco combined had a year-on-year increase of 1.4%, higher than 1.1% in August; non-energy industrial products increased by 1.1% year-on-year, which is slightly lower than 1.2% in August. Therefore, the statement "inflation rose to 3.8%" describes the overall result, not an simultaneous acceleration in all categories. Energy was the fastest-growing category during this period, while there is still a clear differentiation within goods and services.
Excluding energy, food, alcohol, and tobacco, the commonly watched core HICP index saw a year-on-year increase of 2.5% initially, and 2.4% in August. It did not jump by 0.6 percentage points like the overall index, suggesting that widespread and persistent underlying price pressures and energy shocks should be considered separately. However, the core data is not without pressure: services account for a relatively high weight in the basket, and the service price increase returned to 3.2% in September, which warrants continued monitoring of wages, rent, and corporate pricing. If energy prices remain high, they may gradually be passed on to core items through the cost chain. At present, it would be premature to assert that this will never happen.
The inflation felt by households is also affected by the consumption structure. Families that drive frequently and have high energy expenses in winter may face greater pressure from rising energy costs than the average official basket; families that allocate a larger proportion of their budget to food are also more sensitive to the initial figure of a 4.0% year-on-year increase in unprocessed food prices. The official overall index is a tool for comparing the economy as a whole and does not mean that every household's bill has increased by exactly 3.8%. This explains why there can sometimes be a significant discrepancy between macro data and individual perceptions, and there is no need to conclude simply that "statistics are unreliable."
There are significant differences among member countries, and the initial values still need to await verification with complete data.
Further details of the initial national figures reveal that the eurozone does not have a uniform inflation trend: Germany saw a year-on-year inflation rate of 3.3% in September, France at 3.4%, Spain at 5.0%, and Italy at 4.1%; Lithuania reached 6.1%, while Finland had 2.6%. Due to differences in energy structures, tax rates, consumption weights among countries, and last year's bases, these figures cannot be directly used to create a ranking of which country has the best policies. A more cautious approach is to acknowledge that interest rates in a unified monetary area face uneven price pressures, and that the regional average can mask local high inflation rates.
There are also two technical limitations regarding the data itself. First, the quick estimates are marked as such, and the final breakdowns and country-specific data may be revised; a more comprehensive set of details will be provided with the full release on October 16th. Second, starting from January 2026, Bulgaria will join the Eurozone, bringing the total number of member states to 21 from the previous 20. The European Union Statistics Office uses chained indices to account for changes in membership, but when comparing data from different years mechanically side by side, it is still important to be aware of the underlying methodology. The year-on-year and month-on-month comparisons mentioned in this article for September and August are based on the comparable series released by that institution on those respective dates.
Weight also affects intuition. The official table shows that in 2026, the weight of services is about 46.8%, while that of energy is about 9.0%. Although the increase in energy is much higher than that of services, its proportion in the average consumer basket is much smaller; overall inflation is not simply the average of 18.8% and 3.2%. On the contrary, the increase in services may not be as noticeable, but it could have a more lasting impact on the overall index due to its larger share. If we rank only by the percentage increase without considering the consumption weights, it is easy to mistake those with the largest increases for those with the greatest contribution.
A rebound in prices does not automatically determine what the European Central Bank will do next. Policymakers need to assess whether the energy shock will cause prices to rise for a period of time or if it will repeatedly drive up wages and service prices, causing inflation to deviate from its target. Employment, growth, exchange rates, and expectations all influence these judgments. For businesses, whether the cost of purchasing goods is passed on to retail pricing is more direct than the overall figures for a single month; for residents, whether energy costs can come down and whether wages can keep up with rising prices are more critical.
What can be confirmed for now is that at the beginning of September, the value rose from 3.2% to 3.8%, with energy contributing a significant 18.8% to this increase. The core indicator only increased from 2.4% to 2.5%, showing clear differences among member countries. The next test will come on October 16th with the complete data, and thereafter, we will need to observe the trend over consecutive months. To refer to the preliminary figures as final values, or to directly interpret the rise driven by energy as a complete loss of control, could lead readers to misjudge the nature of this inflation rebound.