Fair Isaac The stock price rose by 12.86% at one point during trading on Thursday, and as of 3:38 PM Eastern Time, it was reported at $668.66. However, this rebound still occurred within a daily chart that remains significantly bearish. The question is whether this recovery can truly change the underlying trend.
Key Points
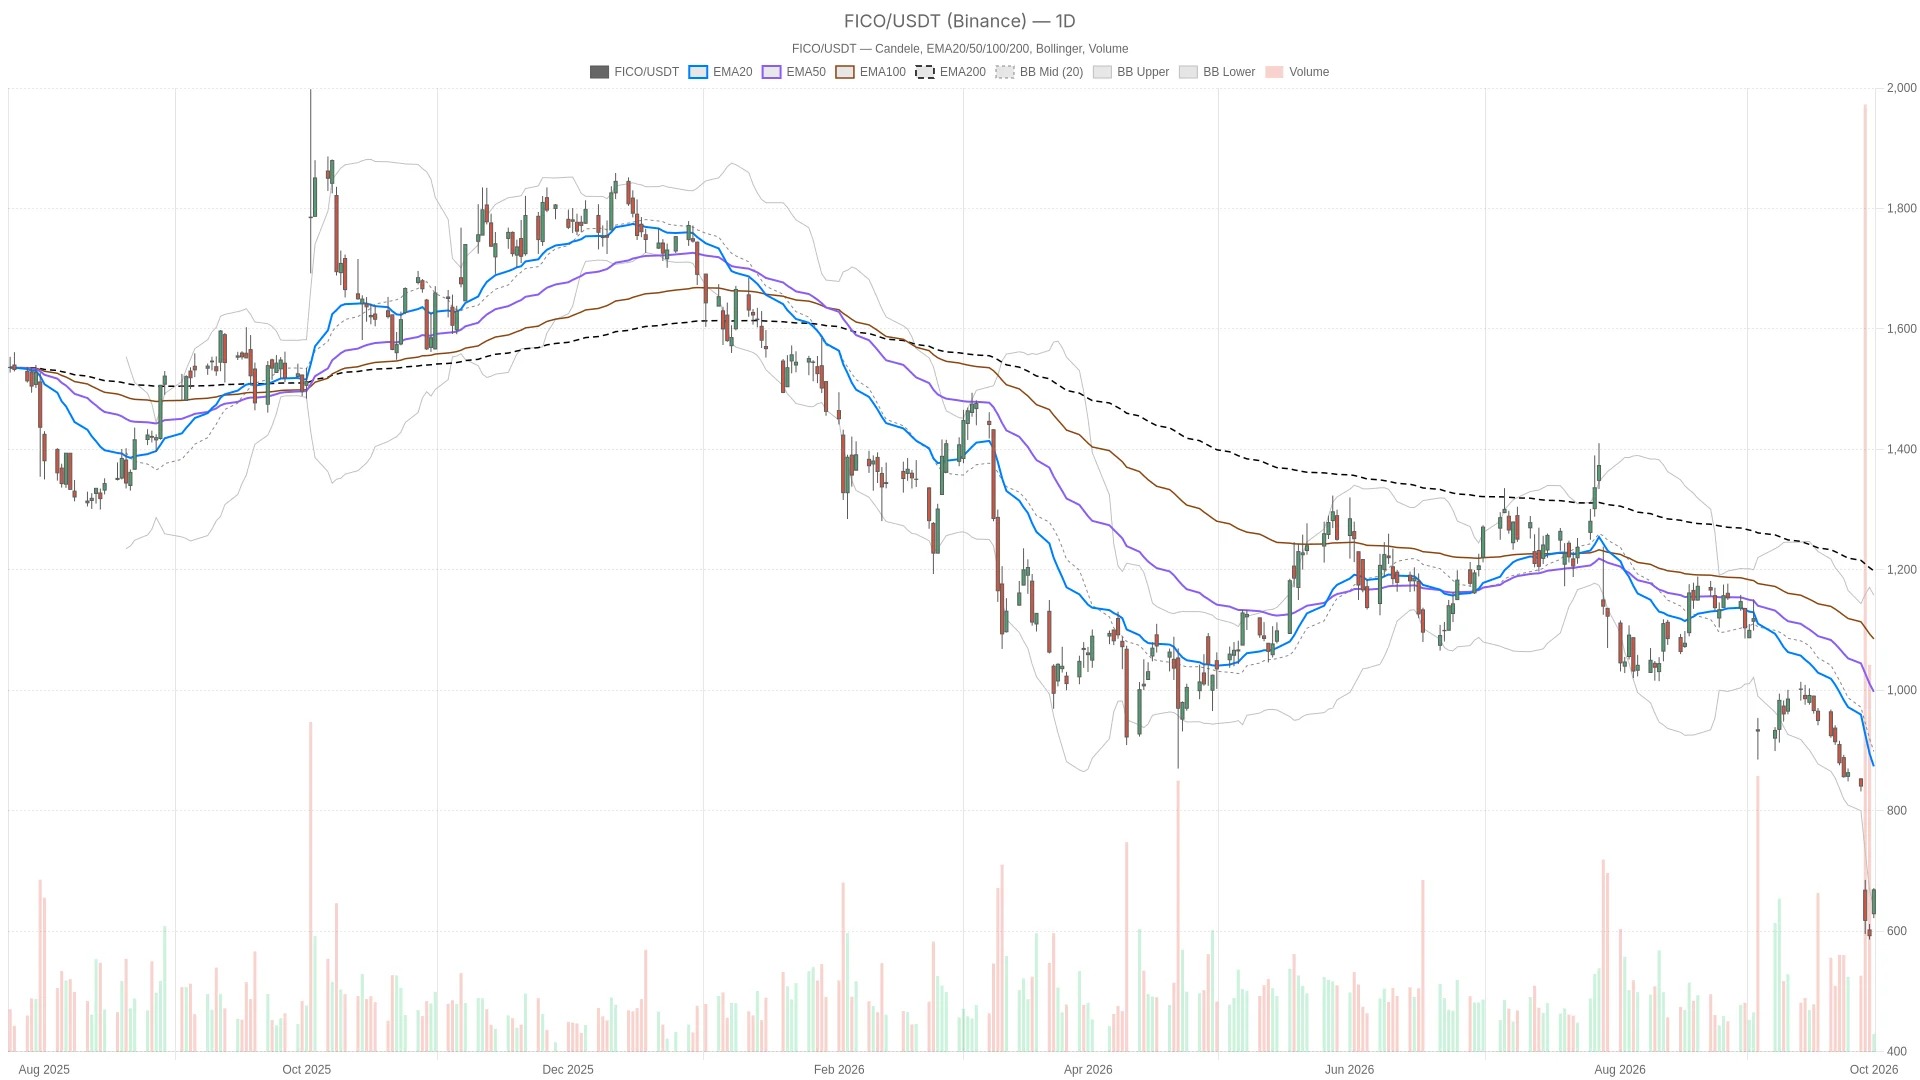
- The daily chart still shows a clearly bearish trend, with the stock price below three main EMA. The value of RSI14 is 26.91.
- The hourly chart shows initial stabilization, but a trend reversal has not yet been confirmed.
- 15-minute chart MACD shows a bearish crossover, indicating a cooling of momentum.
- No specific catalyst for this increase has been clearly identified yet.
Daily chart: The bearish structure of Fair Isaac stock price has not yet been broken.
Despite a significant rally during trading on Thursday, the daily chart of Fair Isaac is still in a clear bearish territory. The price is far below all major moving averages, and momentum indicators also point downwards.
The stock price is reported at $668.66, which is lower than the 20-day EMA of $873.57. This 20-day moving average is also below the 50-day EMA of $997.41, and the 50-day EMA is even lower than the 200-day EMA of $1,226.54. This constitutes a typical bearish pattern, with the stock price far below all major moving averages.
At the same time, RSI14 is at 26.91, which indicates a deep oversold area. This is consistent with the technical pattern of mechanical rebounds that often occur after a significant market decline. The daily MACD line is at -105.11, below the signal line of -75.07, and the MACD bar chart shows -30.04. Even though there was a strong rebound during today's trading session, the momentum in this time frame is still clearly negative.
The daily Bollinger Bands also reinforce this judgment. The middle band is at $898.33, the upper band at $1,157.75, and the lower band at $638.91. The stock price is reported at $668.66, which is slightly above the lower band but far below the middle band. This indicates that the stock is still in the lower half of its own range of fluctuations. Fair Isaac
The daily line ATR14 is at 58.1. As of Thursday, the range has been from a low of $621.64 to a high of $671.55, indicating that the volatility is quite wide. At the same time, the daily pivot points calculated based on Wednesday's K-line, which are $596.84 and R1 at $607.64, have both been broken through. In other words, today's rebound has far exceeded the resistance levels set by this daily pivot framework for today's trading session.
Hourly chart: Initial stabilization observed, but recovery not yet confirmed.

The hourly chart makes the situation more complicated, rather than confirming the bearish bias on the daily chart. A short-term strength has already appeared, but the broader hourly trend has not yet truly turned around.
The price of $668.66 is higher than the $663.57 from 20 hours ago EMA, but it is still lower than the $741.79 from 50 hours ago EMA and the $920.34 from 200 hours ago EMA. This arrangement is mixed and does not represent a clear bullish or bearish trend. It indicates that the short-term rebound has not yet corrected the broader hourly trend.
At the same time, on the hourly chart, RSI14 is at 45.59, which is basically in a neutral range. The hourly MACD line is at -28.64, which is already above the signal line of -45.19, forming a positive bar chart of 16.55. However, both the MACD line and the signal line are still below the zero axis. This is more indicative of weakening downward momentum, rather than a confirmed bullish reversal.
From a volatility perspective, the middle band of the hourly Bollinger Bands is at $623.79, the upper band at $680.60, and the lower band at $566.99. The price is located between the middle and upper bands, and is closer to the upper band. This position supports a strong short-term trend.
At the same time, the hourly pivot point is at $666.84, R1 is at $673.07, and S1 is at $662.52. The price is currently above the pivot point and is testing in the direction of R1. This is a relatively positive short-term signal, but there is still a long way to go before reversing the daily downward trend.
15-minute chart: Momentum begins to cool down after a surge
The 15-minute chart shows that the initial buying pressure is beginning to show signs of weakening. Although the price has managed to maintain its intraday gain, a bearish crossover has appeared on the 15-minute MACD chart.
On the 15-minute chart, the price of $668.66 is higher than the 20-week EMA level of $658.25 and the 50-week EMA level of $650.43, but it is still below the 200-week EMA level of $755.02. The RSI14 level is at $64.62, and after a significant increase, it has approached the overbought area.
It is worth noting that at 15 minutes, the line at 10.98 has slightly fallen below the signal line at 12.02, forming a small negative bar chart of -1.03. This represents a mild bearish crossover on the shortest time frame, indicating that the initial buying momentum is weakening, although the price is still maintaining an upward trend.
At the same time, the 15-minute pivot point is at $667.59, R1 is at $669.91, and S1 is at $666.44. Prices are currently confined between the pivot point and R1. This indicates that the market is more likely to be digesting this round of gains rather than continuing to extend strongly.
What can the news stream tell us, and what can't it tell us?
Recent reports help to explain the market sentiment towards Fair Isaac, but they do not explain the specific reasons for the rally on Thursday. As of yet, no single catalyst has been identified.
Seeking Alpha reports that Fair Isaac fell on Wednesday. Previously, BofA Securities downgraded its rating from buy to neutral. This downgrade occurred after the Federal Housing Finance Agency placed VantageScore's 4.0 rating and the classic F-token issuance rating in the same loan grade pricing adjustment table. This decision eliminated the previous pricing distinctions the company had.
In addition, a report by Yahoo Finance compared Fair Isaac with other companies in the same rating group, including Equifax and TransUnion. Although Fair Isaac had stronger revenue growth and operating profit margins, its stock price has fallen by 59.3% over the past 12 months, resulting in the worst return among this group of companies.
Meanwhile, Seeking Alpha released two opinions this week, which were noticeably more frequent than usual. One opinion suggests that Fair Isaac has buying value around $840, on the grounds that the stock price has fallen by 26%, yet the company's operational performance continues to be strong. The other opinion was released before the opening on Thursday and goes even further, suggesting that a 75% decline is sufficient to make the risk-return ratio of this stock attractive.
However, an article published by Investing.com during the trading session on Thursday directly addressed the question of why the stock price of Fair Isaac had risen. The article linked this phenomenon to broader market cross-effects, including rising oil prices and a resumption of selling in the bond market, but did not identify the specific triggering factors for Fair Isaac itself. Therefore, the existing reports cannot determine the exact cause of today's rise.
Long position scenario: What needs to happen?
Longs need to hold the pivot point of $666.84 on the hourly chart and break through the $673.07 R1. If they can re-establish themselves above the $741.79 50-hour EMA, it will further indicate that the downward trend on the hourly scale is indeed turning around.
If the bulls want to continue today's trend, the hourly chart must continue to hold the pivot point of $666.84 and effectively break through the $673.07 R1. Regaining the $741.79 50-hour EMA would mark a more significant change.
Even so, on the daily chart, RSI14 needs to continue to rebound from 26.91. Ultimately, the price also needs to re-cross the 20-day EMA of $873.57 in order to truly challenge the broader bearish structure.
Bearish scenario: What could undermine this rebound?
If the Fair Isaac stock price falls below 666.44 USD on the 15-minute chart S1, and also breaks below the hourly pivot point of 666.84 USD, then today's rebound will be more like a mean reversion rebound within a larger downward trend, rather than a true reversal.
On the contrary, if the price falls back below the 15-minute pivot support of $666.44 and loses the hourly pivot point of $666.84, then today's rise will take on a different nature. It would be more like a mean reversion rebound within a larger downward trend, rather than a true reversal.
In addition, if the price falls back near the lower band of the 638.91 USD daily Bollinger Bands, the bearish trend will once again take the upper hand. Since the daily MACD bar chart still shows -30.04, and the price is still below the three daily EMA, the downward trend will continue to remain intact.
Overall, the stock price of Fair Isaac is exhibiting a typical seesaw pattern. The oversold daily chart conflicts with the short-term rebound that has not yet been confirmed in higher time frames. Volatility remains high, with a daily ATR14 of 58.1. Since the trading session has not yet ended, today's data may still change before the close.
However, current position operations surrounding the stock price of Fair Isaac face conflicting signals: the daily trend remains bearish, the hourly trend has only just begun to stabilize, while the 15-minute chart indicates that momentum is starting to cool down. Given that no specific news catalyst that drove today's upward movement has been clearly identified yet, it seems reasonable to adopt a cautious attitude towards the sustainability of this rebound.
Frequently Asked Questions
Fair Isaac What is the technical outlook for the stock price?
The daily chart still shows a clearly bearish trend. The stock price of $668.66 is lower than the 20-day EMA of $873.57, the 50-day EMA of $997.41, and the 200-day EMA of $1,226.54. The hourly chart indicates a preliminary stabilization, but the 15-minute chart shows that the momentum is cooling down after a short-term surge during trading hours.
What key price levels need to be monitored?
On the hourly chart, the pivot point is at $666.84, R1 is at $673.07, and S1 is at $662.52. On the daily chart, the lower band of the Bollinger Bands at $638.91 and the 20-day EMA at $873.57 are key reference levels. If it can break through the 50-hour EMA of $741.79, that would be a more significant bullish signal.
Can the rebound in the market continue?
This rebound has not yet been confirmed on a higher time frame. A bearish crossover has appeared at the 15-minute MACD level, indicating that the initial buying momentum is cooling down. If it cannot re-establish itself above the key hourly levels and continue to remain above the daily EMA level, this rebound may merely be a mean reversion within the overall downward trend.
This article was generated with the assistance of artificial intelligence and has been reviewed by an editorial team.