












Nike's stock price closed at $35.08 on Thursday (October 1, 2026), down 0.9% from $35.40. The decline during the trading day was even greater, at about 1.04%, with selling pressure gradually intensifying throughout the session. This drop occurred ahead of Nike's upcoming release of its financial report for the first quarter of fiscal year 2027, and it further reinforced the weakening technical trend of the stock.
Key Points
- Nike's stock price closed at $35.08 on Thursday, down 0.9%, ahead of the first-quarter financial report for the fiscal year 2027.
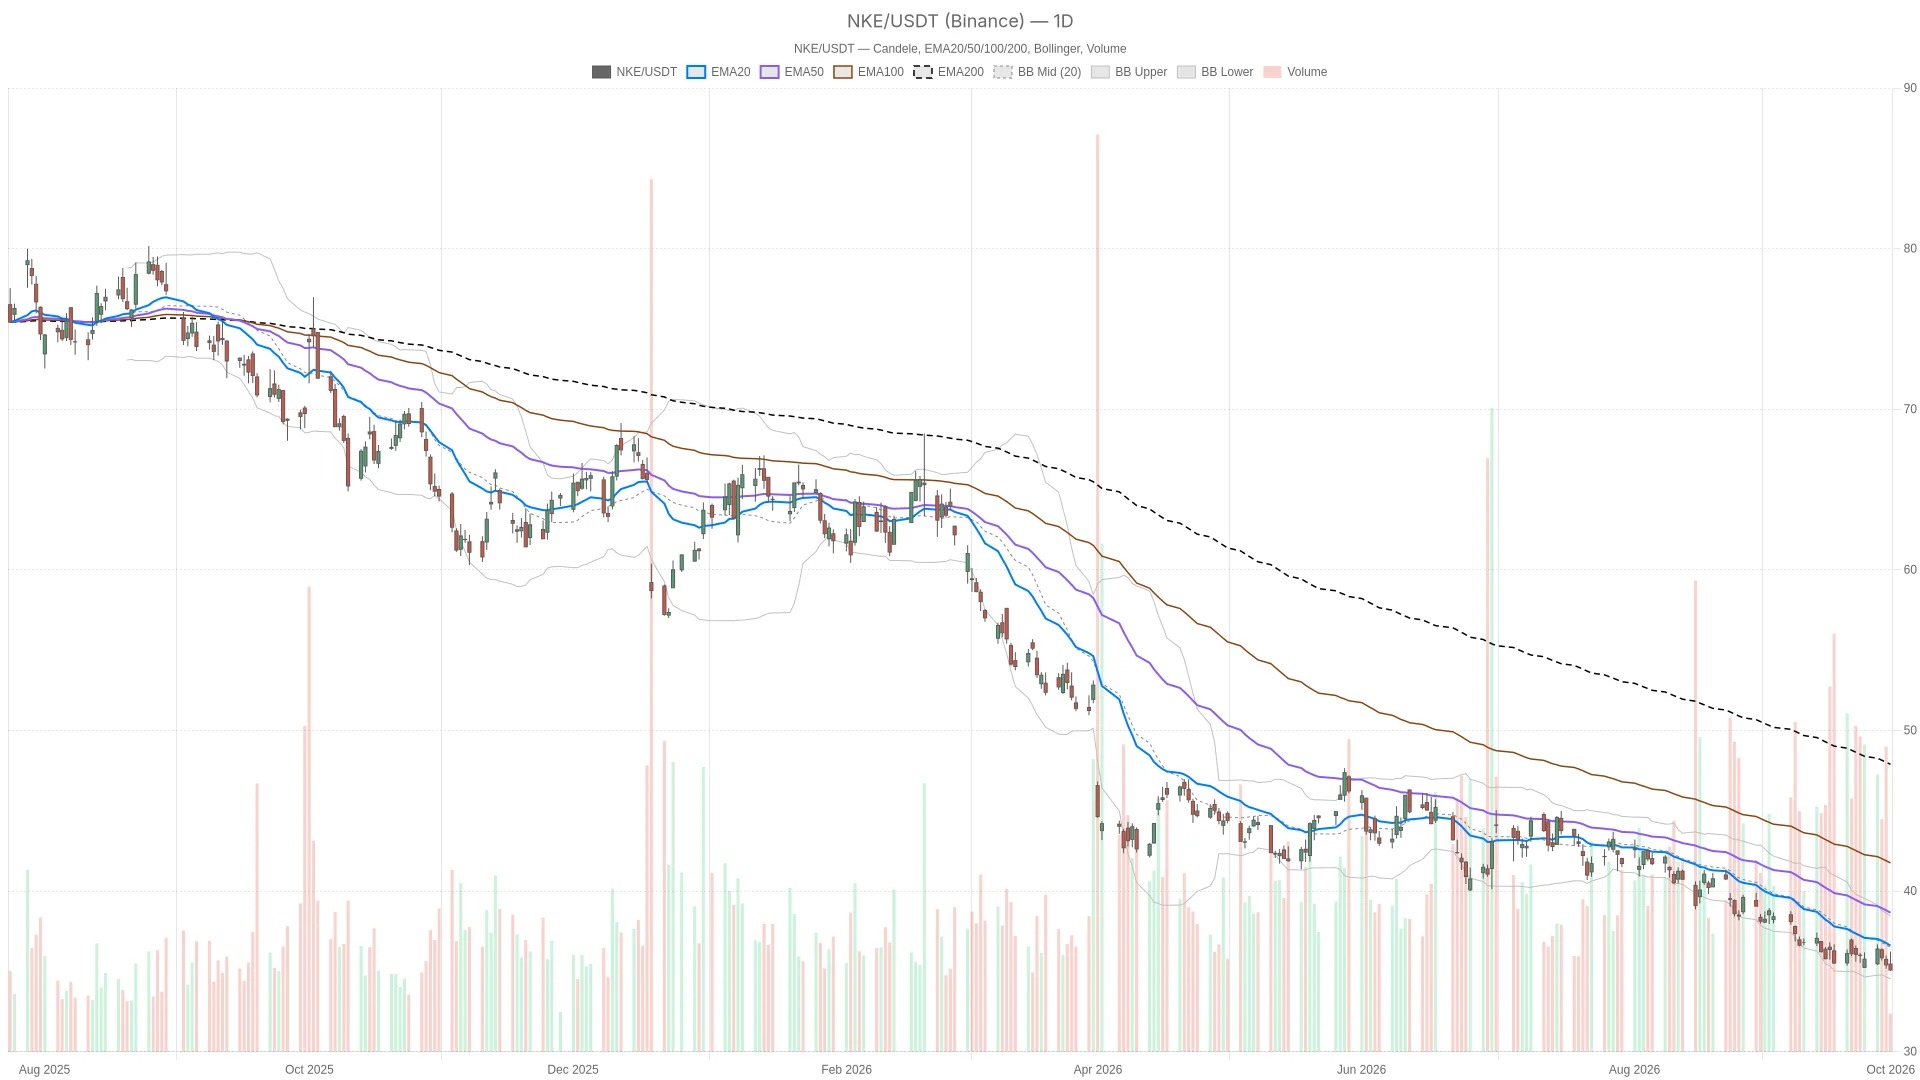
- The daily chart shows that the bearish moving averages are aligned, with the stock price below the 20-day, 50-day, and 200-day exponential moving averages.
- The daily RSI14 is at 33.68, indicating oversold conditions; the 15-minute RSI14 is at 28.03, which is clearly in an oversold state.
Nike stock price technical structure: Bearish trend still dominates
The daily chart shows a clear bearish structure in Nike's stock price. The price of $35.08 is below the 20-day exponential moving average of $36.60, which in turn is below the 50-day exponential moving average of $38.65; the 50-day moving average is also below the 200-day exponential moving average of $48.91. All the major moving averages are trending downward, and the price is below all three moving averages, which constitutes a typical bearish pattern.
The momentum indicator shows a similar pattern, with slight differences. The daily RSI14 reading is 33.68, close to oversold territory but not yet in the extreme range. The MACD line is at -1.04, and the signal line is at -1.10, both in the negative range. However, the bar chart has rebounded to 0.06. This slight positive movement indicates that, although the overall trend is still downward, the rate of decline may be slowing down. This is worth noting, but it does not in itself constitute a reversal signal.
Bollinger Bands also provide supplementary information. The price of $35.08 is located between the middle band of $36.48 and the lower band of $34.53, leaning towards the lower edge of the range. The ATR14 value is 0.99, indicating that the stock's intraday volatility is not small. For the next trading day, the pivot point is at $35.44, the first resistance level is at $35.87, and the first support level is at $34.66. These levels are worth monitoring after the market reopens.
Hourly chart and 15-minute chart: Short-term trend extension, but no clear reversal has yet occurred.

Hourly chart confirms a bearish bias.
The hourly chart confirms the bearish judgment on the daily chart, rather than complicating the situation further. The price is below the 20-hour exponential moving average of $35.71, which in turn is below the 50-hour exponential moving average of $35.89; the 50-hour average is also below the 200-hour exponential moving average of $37.43. This is consistent with the bearish pattern on the daily chart. Notably, the price of $35.08 has also fallen below the lower band of the hourly Bollinger Bands at $35.23, indicating that the short-term decline has been somewhat excessive. The RSI14 indicator on the hourly chart shows a value of 36.86, which is weak but not yet in a state of deep oversold. The MACD indicator reads -0.11, below the zero line and the signal line of -0.09; the negative bar chart indicates a value of -0.02, confirming that bearish momentum still exists within this time frame.
15-minute chart: Entering oversold territory before the close
On the 15-minute chart, the situation is even more apparent. RSI14 has dropped to 28.03, which is clearly an over-sold condition for this time frame. The MACD line is at -0.04, in the negative range, while the signal line at 0.06 remains positive. The bar chart shows -0.09, indicating that short-term selling pressure is still increasing before the close. The price of $35.08 is lower than the 15-minute EMA20 and EMA50, both of which are at $35.77, and also lower than EMA200 at $35.88. At the same time, the price is below the lower band of the Bollinger Bands at $35.31. For this time frame, the pivot point for the next trading day is at $35.18, the resistance level is at $35.35, and the support level is at $34.92. Compared to the slight improvement in the daily bar chart, the short-term pattern suggests that the stock price will continue to be under pressure until there is any substantial stabilization.
Financial report catalyst: Record short positions encounter lower-than-expected thresholds
Prior to the financial report, this technical background was compounded by an exceptionally sensitive market environment. A report from Investing.com described Nike's upcoming first-quarter results for the fiscal year 2027 as an event with "low barriers to entry and high risk." Meanwhile, a report from CNBC stated that the market expects Nike to announce another quarter of declining sales. The company is working hard to turn around its business and regain growth in China.
Meanwhile, a report from Yahoo Finance indicates that Nike's stock price has fallen by 44% this year. Short positions have risen to a record 87 million shares. Another report from Yahoo Finance citing S3 Partners states that short sellers have made a paper profit of about $1.4 billion this year. However, the report also adds that if financial results exceed expectations, it may force some short sellers to cover their positions. Additionally, a report from Seeking Alpha mentions that Nike is launching Caitlin Clark signature shoes and a global clothing line, with related pricing and product details being disclosed gradually before the financial report is released. Nevertheless, this seems more like a story about a secondary brand rather than a major driving factor for the short-term technical outlook.
Bullish scenario: What could support a reversal?
To create a bullish scenario for Nike's stock price, the price first needs to re-establish itself above the daily pivot point of $35.44, and then break through the first resistance level of $35.87. If it can return above the $36.60 level mentioned in the daily chart, that would be an even more significant signal, indicating that the bearish position is starting to weaken. Considering the record-level bearish positions mentioned in Yahoo Finance, if the financial report exceeds expectations, the stock price could accelerate its upward movement. If bearish covering starts, the dynamics described in S3 Partners could also occur. This corresponds to what Investing.com refers to as a "low threshold," further increasing this possibility.
Therefore, a slight strengthening in the daily MACD bar chart is even more important in this context. If momentum continues to improve and is accompanied by a price rebound, the patterns on the daily and hourly charts will become more consistent. Currently, neither chart fully supports a bullish trend reversal.
Bearish scenario: What would confirm further decline?
On the other hand, if the stock price falls below the first support level of $34.66 on the daily chart, it would indicate that sellers are still in control of the situation. This outcome is also consistent with the reporting framework of CNBC. The report emphasizes that Nike may experience another decline in sales, and its business in China remains weak. The daily EMA200 level is at $48.91, which is significantly higher than the current stock price, highlighting the large gap between this stock and its long-term trend.
Overall, unless the financial reports bring clear surprises, the broader momentum remains favorably inclined towards the sellers. The daily RSI14 is still below 50, and both the daily and hourly MACD lines are negative. If Nike's stock price cannot re-establish itself above the daily pivot point of $35.44, it is likely to remain trapped within the recent range.
Closing Viewpoint: Volatile Positions Ahead of the Financial Report Window
Overall, before Nike announced its financial results for the first quarter of fiscal year 2027, the daily trend was still clearly bearish. The hourly chart confirmed this bias. Although the 15-minute chart indicated a technical oversold condition, there has not yet been a real reversal. The daily ATR14 level is at $0.99, which suggests that the daily fluctuations for this stock could be quite significant. The record-high short positions mentioned in Yahoo Finance also add additional volatility around the time of the financial report release. Due to conflicting signals, there is obvious uncertainty when it comes to positioning strategies around this reporting period. The short-term oversold readings are in contradiction with the still intact downward daily trend.
Frequently Asked Questions
What are the key technical levels for Nike's stock price?
The daily pivot point is at $35.44, the first resistance level is at $35.87, and the first support level is at $34.66. The price of $35.08 is still lower than the 20-day EMA of $36.60, the 50-day EMA of $38.65, and the 200-day EMA of $48.91.
What is the situation with the short positions in Nike's stock price?
What would indicate a bullish reversal in Nike's stock price?
For a bullish reversal, the price needs to re-establish itself above the daily pivot point of $35.44 and break through the first resistance level of $35.87. If it can return above the daily EMA20 level of $36.60, it will more strongly indicate that the bearish trend is weakening.
What are the market expectations for Nike's financial report?
CNBC reports that the market expects Nike to announce another quarter of declining sales. The company is working hard to turn around its business and restore growth in China. Investing.com describes this announcement as an event with "low barriers to entry and high risk."
This article was generated with the assistance of artificial intelligence and has been reviewed by an editorial team.