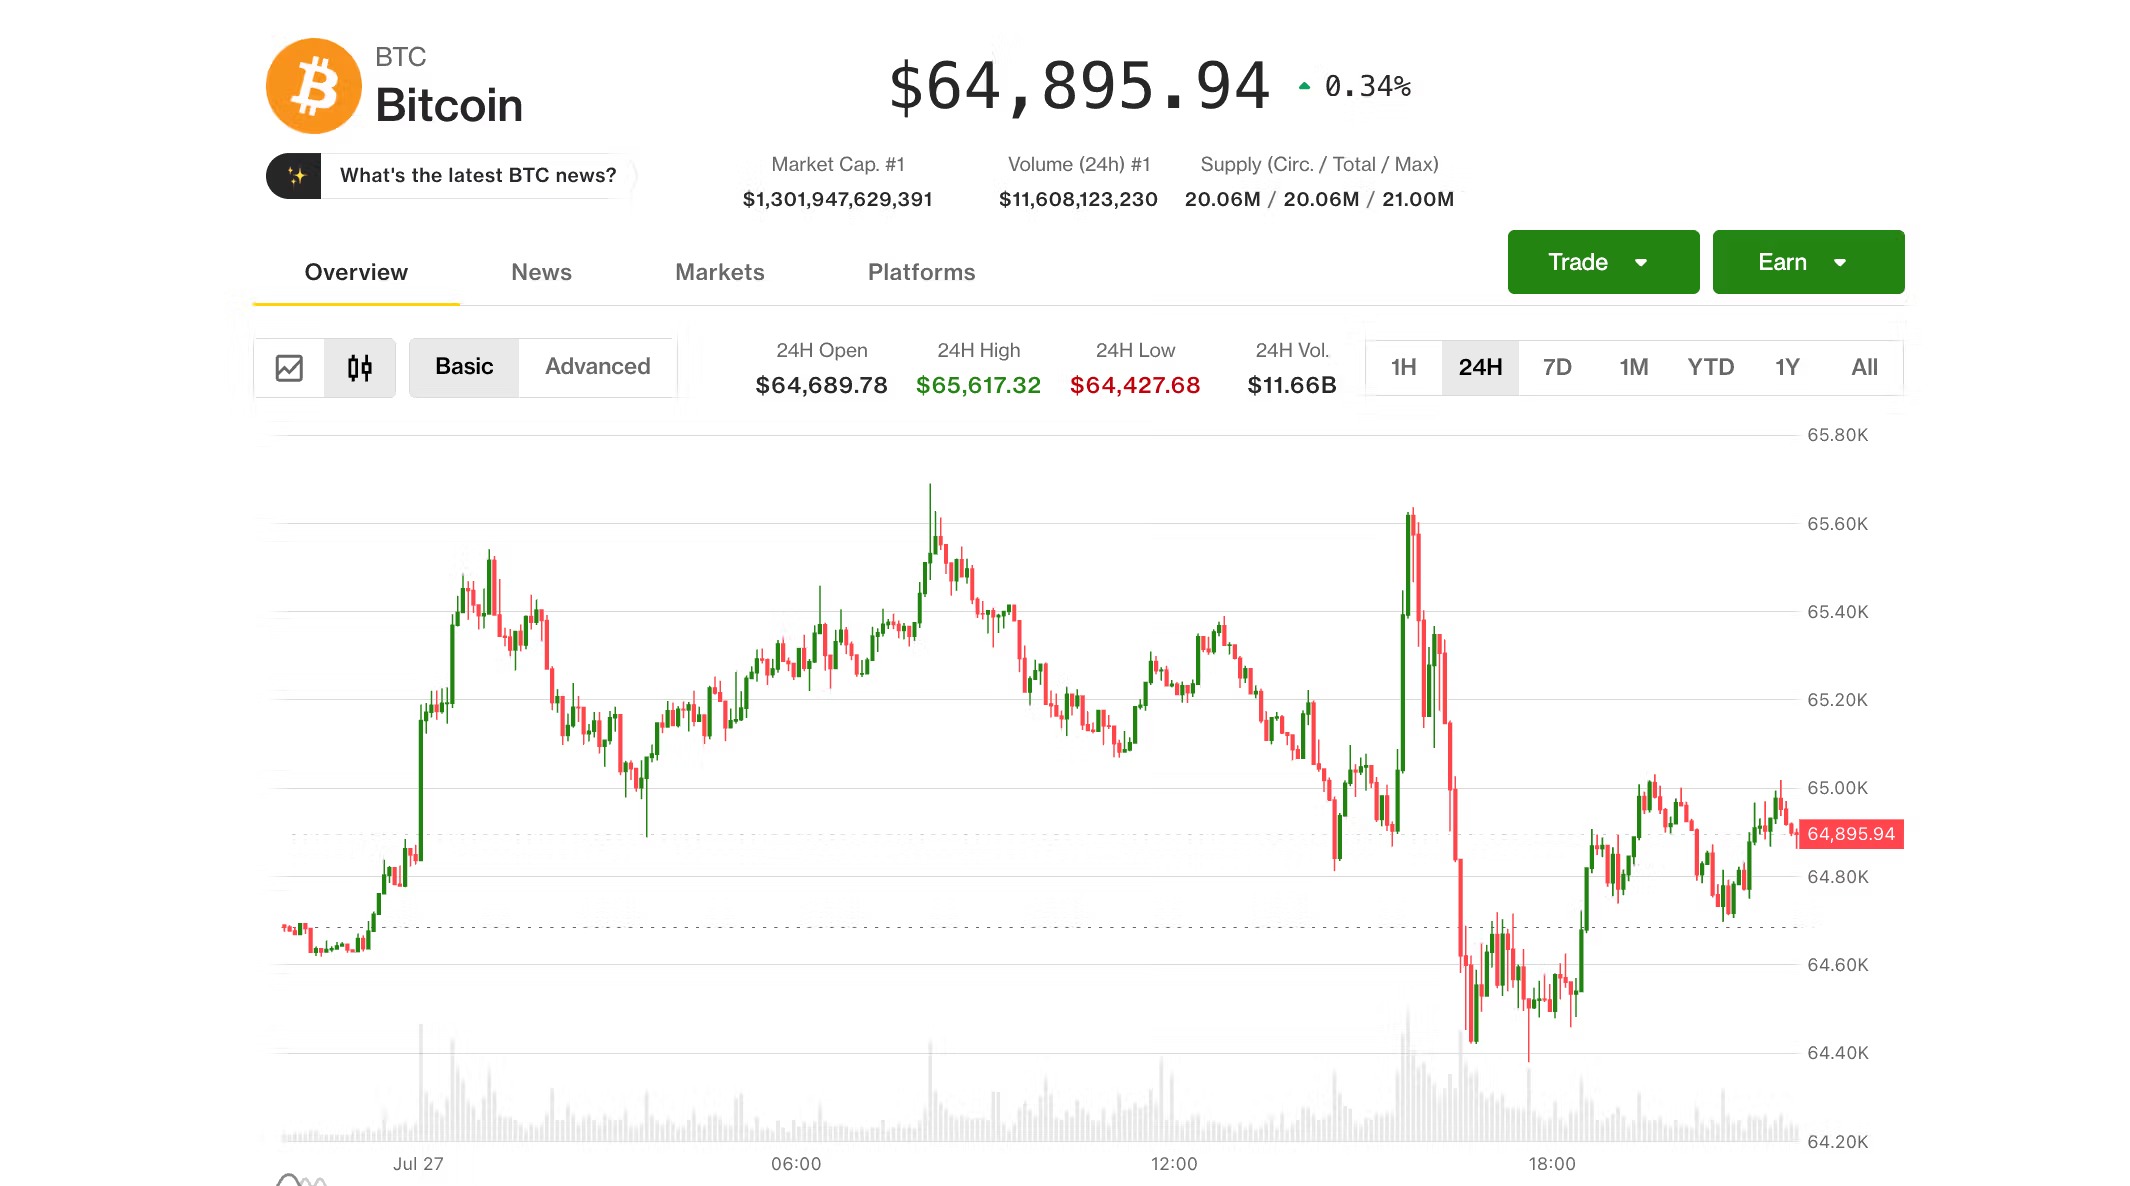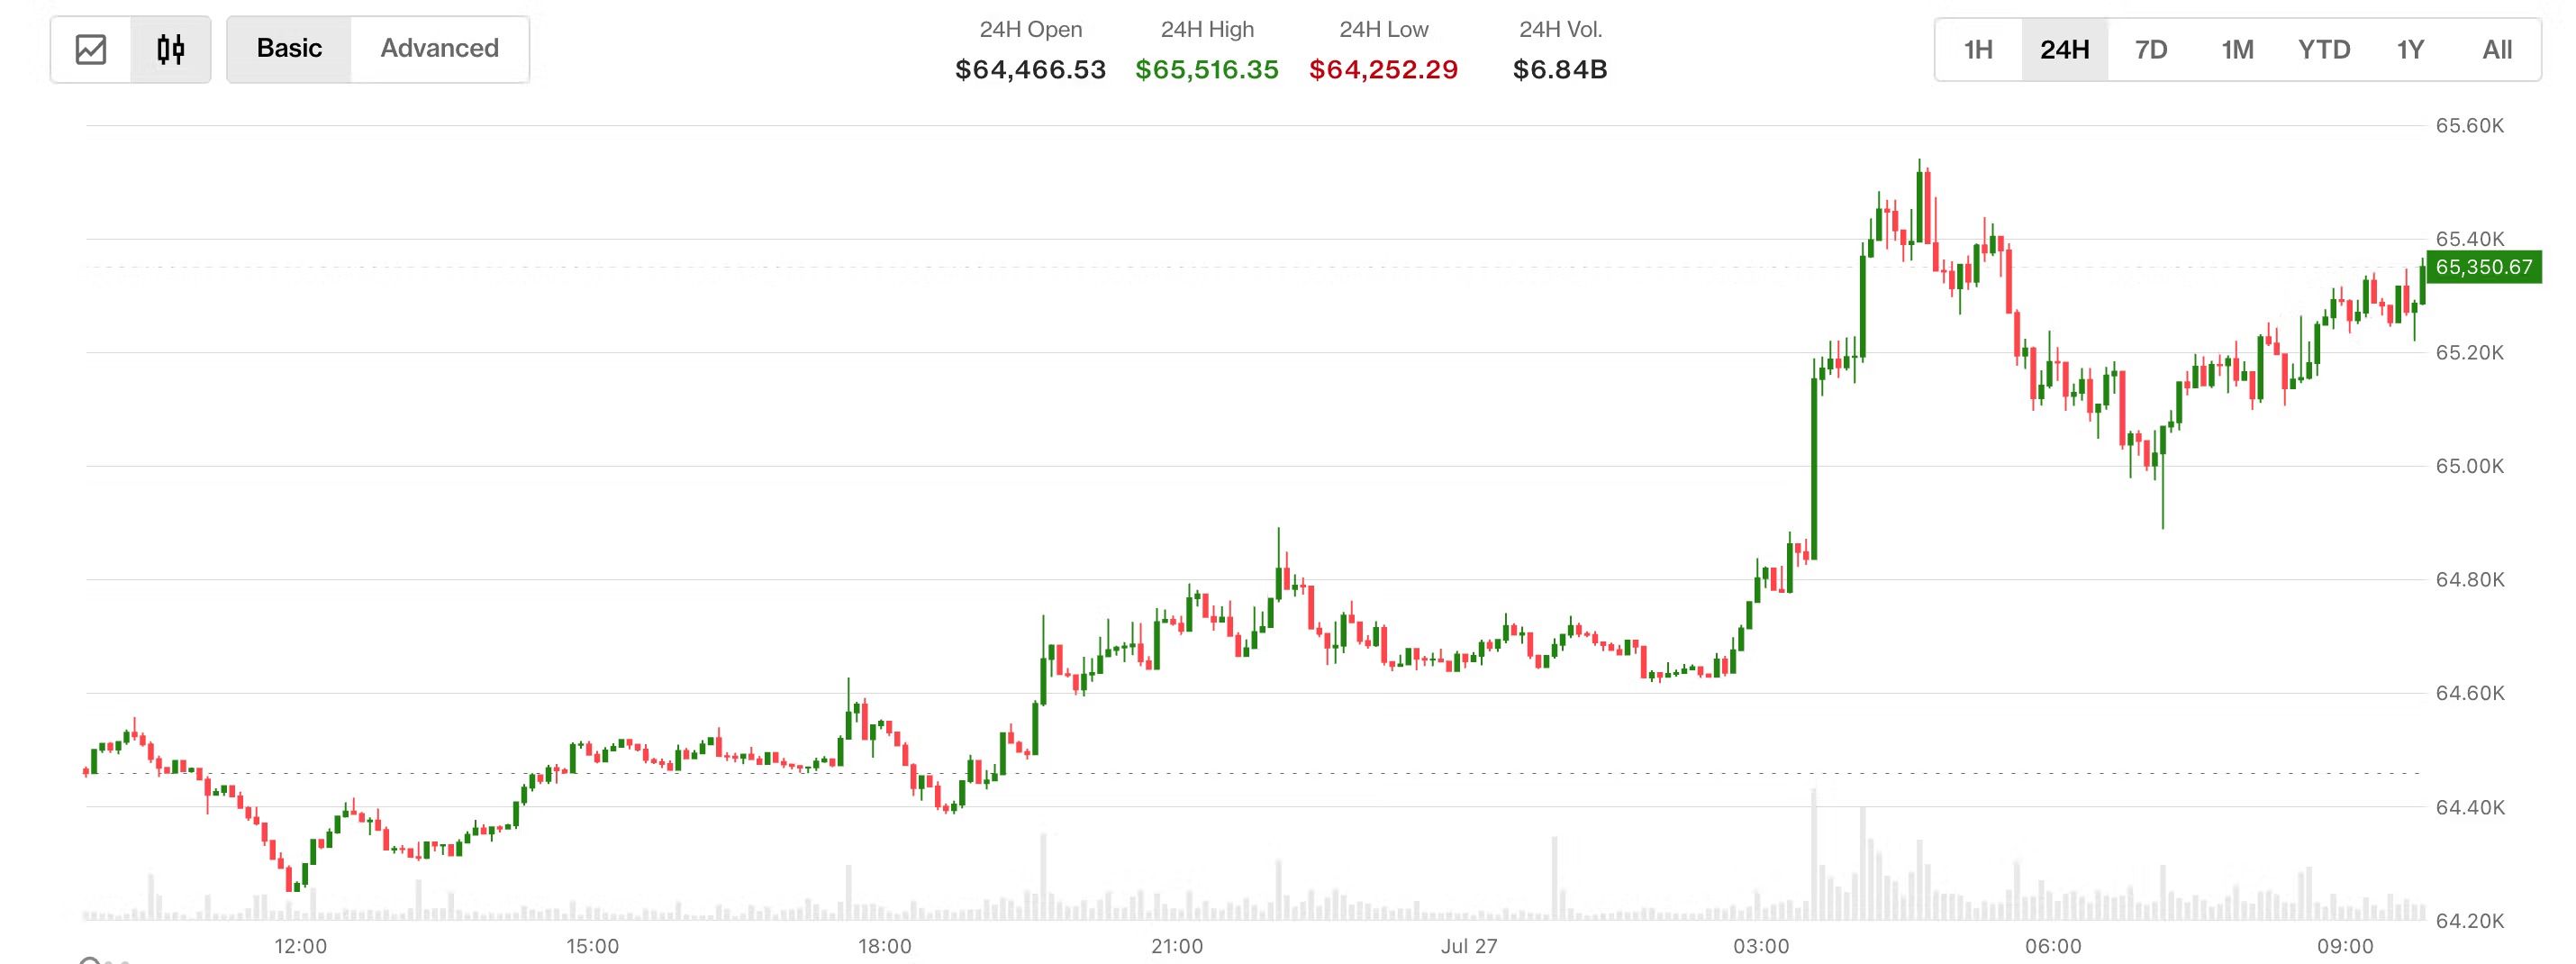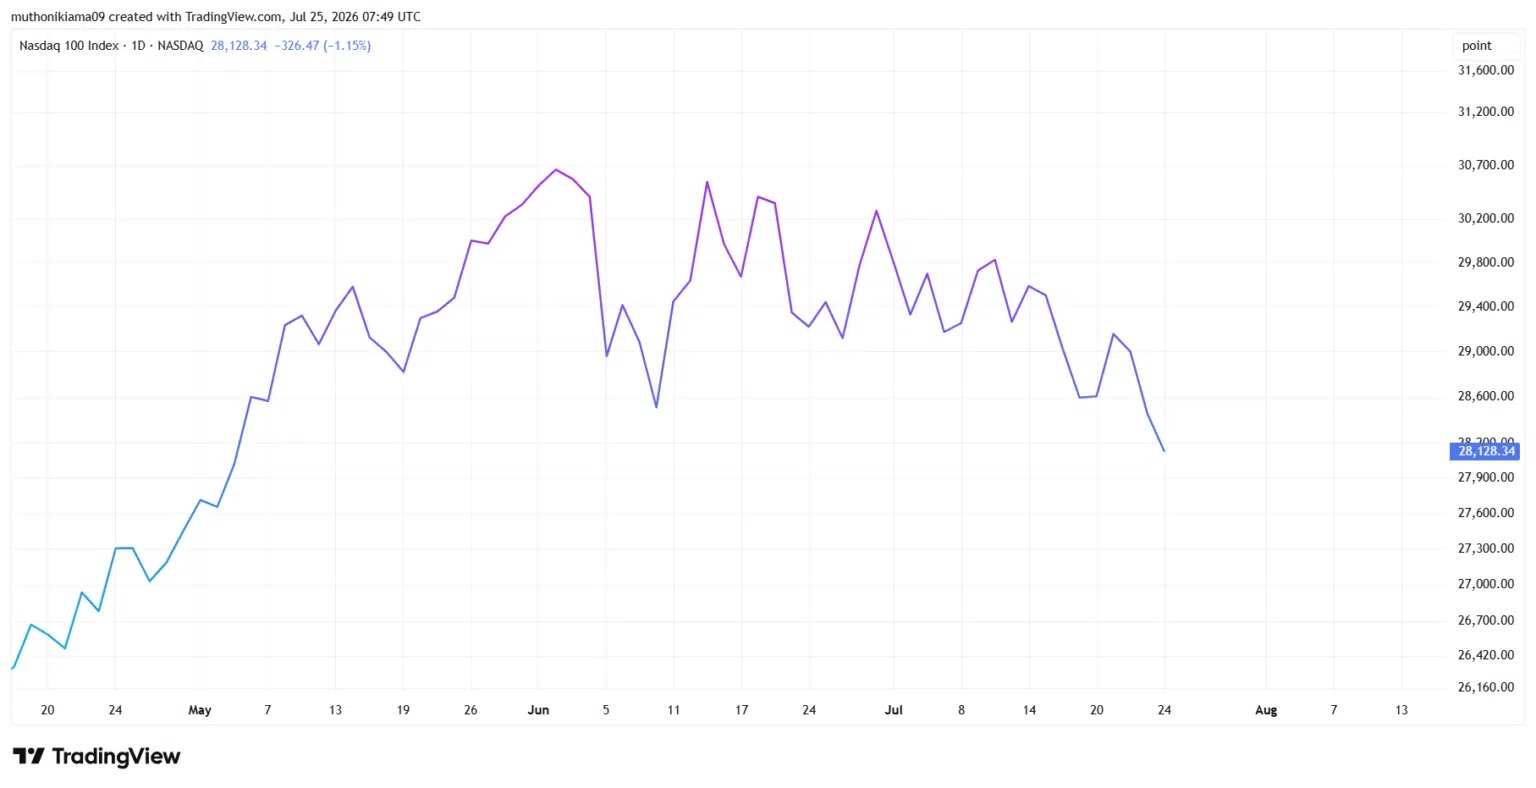


For the third consecutive day, the US and Iran refrained from launching further attacks, temporarily easing market concerns about supply disruptions in the Middle East. Following a decline in oil prices, risk assets such as stocks and cryptocurrencies rebounded in tandem. On July 27, Bitcoin rose to $65,386, a significant recovery from its intraday low of $64,892.
Oil price decline triggers rebound
Reports indicate that regional mediators are pushing for a temporary ceasefire arrangement, but direct negotiations between Washington and Tehran have not yet resumed. Meanwhile, Iran and Oman are also discussing shipping management issues in the Strait of Hormuz.
Brent crude fell 6.5% to $90.45. The decline in energy prices eased market concerns about inflationary pressures, boosting demand for risk assets. For the crypto market, this shift comes ahead of the Federal Reserve's July 28-29 policy meeting.
However, geopolitical risks have not completely disappeared. The Iranian Foreign Ministry stated that Tehran has not requested the resumption of negotiations with the United States, and the status quo in the Strait of Hormuz remains unchanged. Reuters reports that the interest rate futures market is currently pricing in a 33% probability of an interest rate hike, up from 16% a week ago.
$67,000 remains a barrier.
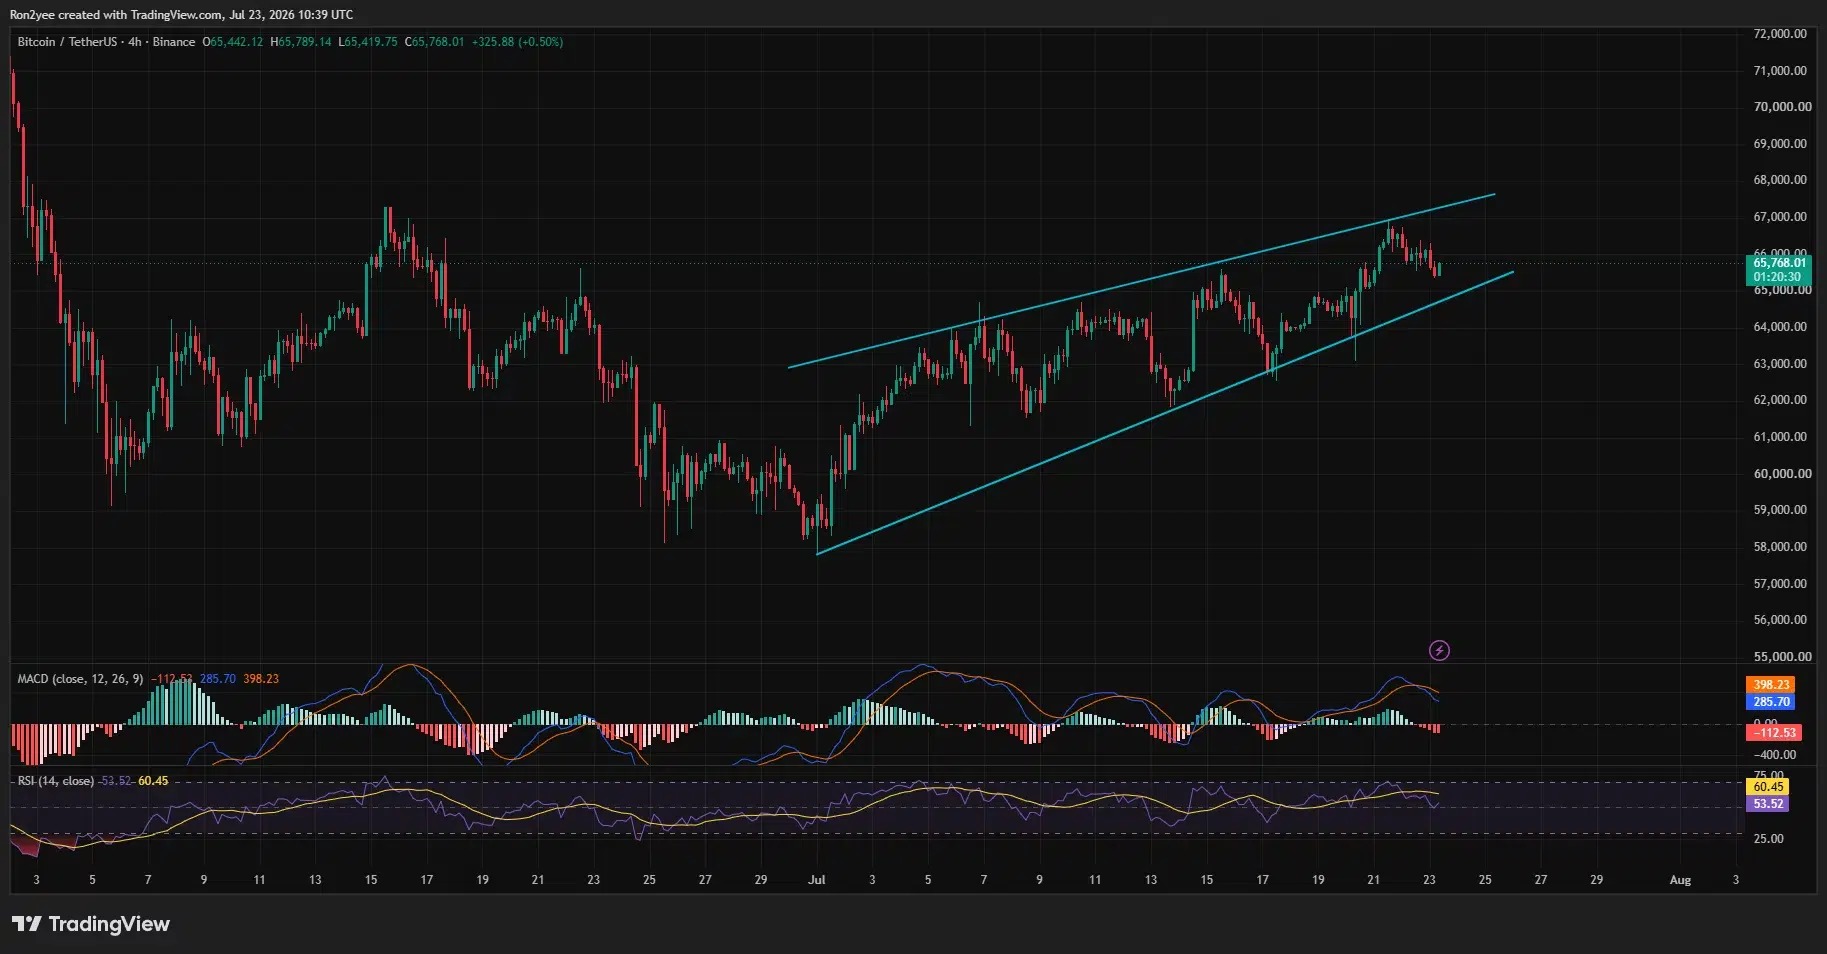
From a chart perspective, Bitcoin is still trading within a 4-hour ascending channel. The lower edge of the channel is roughly around $64,000, while the upper edge corresponds to the $67,800 to $68,000 range.
Since July 25, Bitcoin has rebounded from the lower edge of the channel and climbed back above $65,000, continuing the upward trend that began in early July. This structure could only be broken if it subsequently falls below the support level around $64,000.
Momentum indicators have also improved. The 4-hour RSI rose to 58.64, above its moving average of 47.45, but has not yet entered overbought territory. The MACD has also shown a bullish crossover, indicating that upward momentum is recovering after the previous pullback.
ETF fund flows remain unstable
The next key level to watch is $67,181. This level previously capped the gains on July 21 and is also close to the upper edge of the 4-hour channel. If the daily chart effectively breaks above this level, the price may further test the $68,000 area.
CoinGlass's three-day liquidation heatmap shows that Bitcoin's recent rebound has swept through several high-leverage zones between $64,500 and $65,300, forcing some short positions to be liquidated and further pushing up prices.
Meanwhile, fund flows into spot Bitcoin ETFs remain volatile. While the fund recently recorded a net inflow of $33 million, SoSoValue data shows a single-day net outflow of $240.08 million on July 24th. This indicates that institutional demand has improved somewhat, but is not yet sufficient to confirm a sustained reversal.
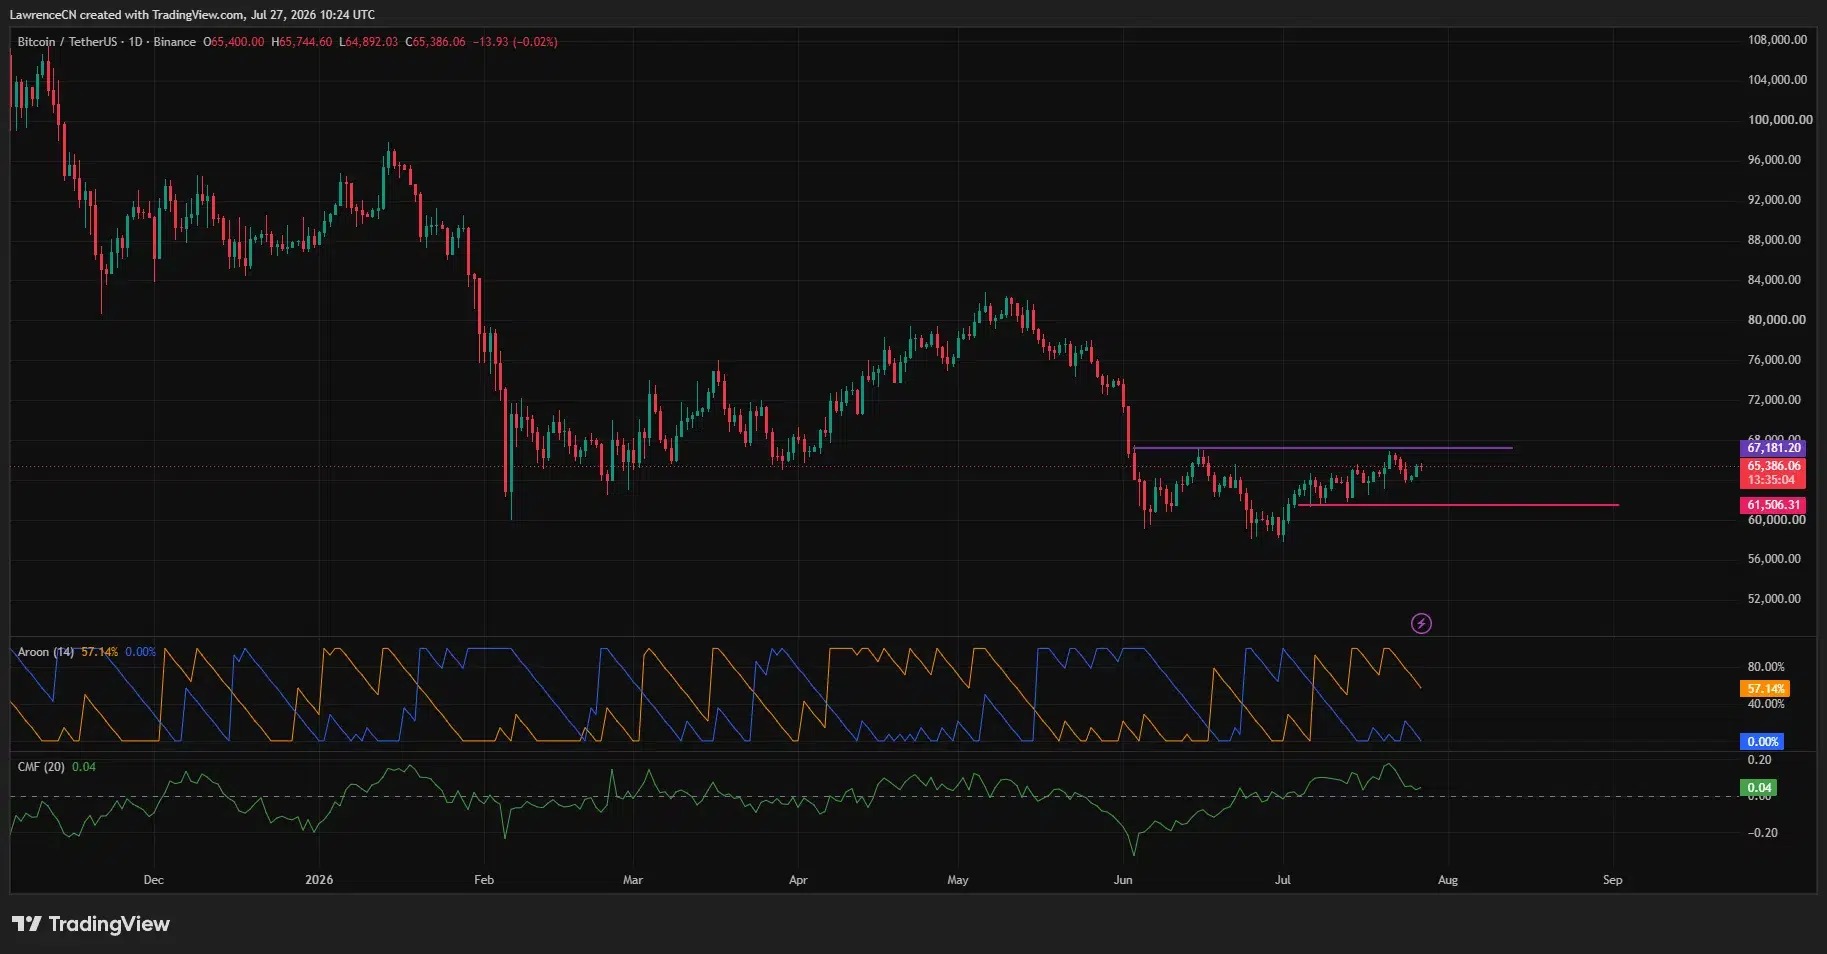
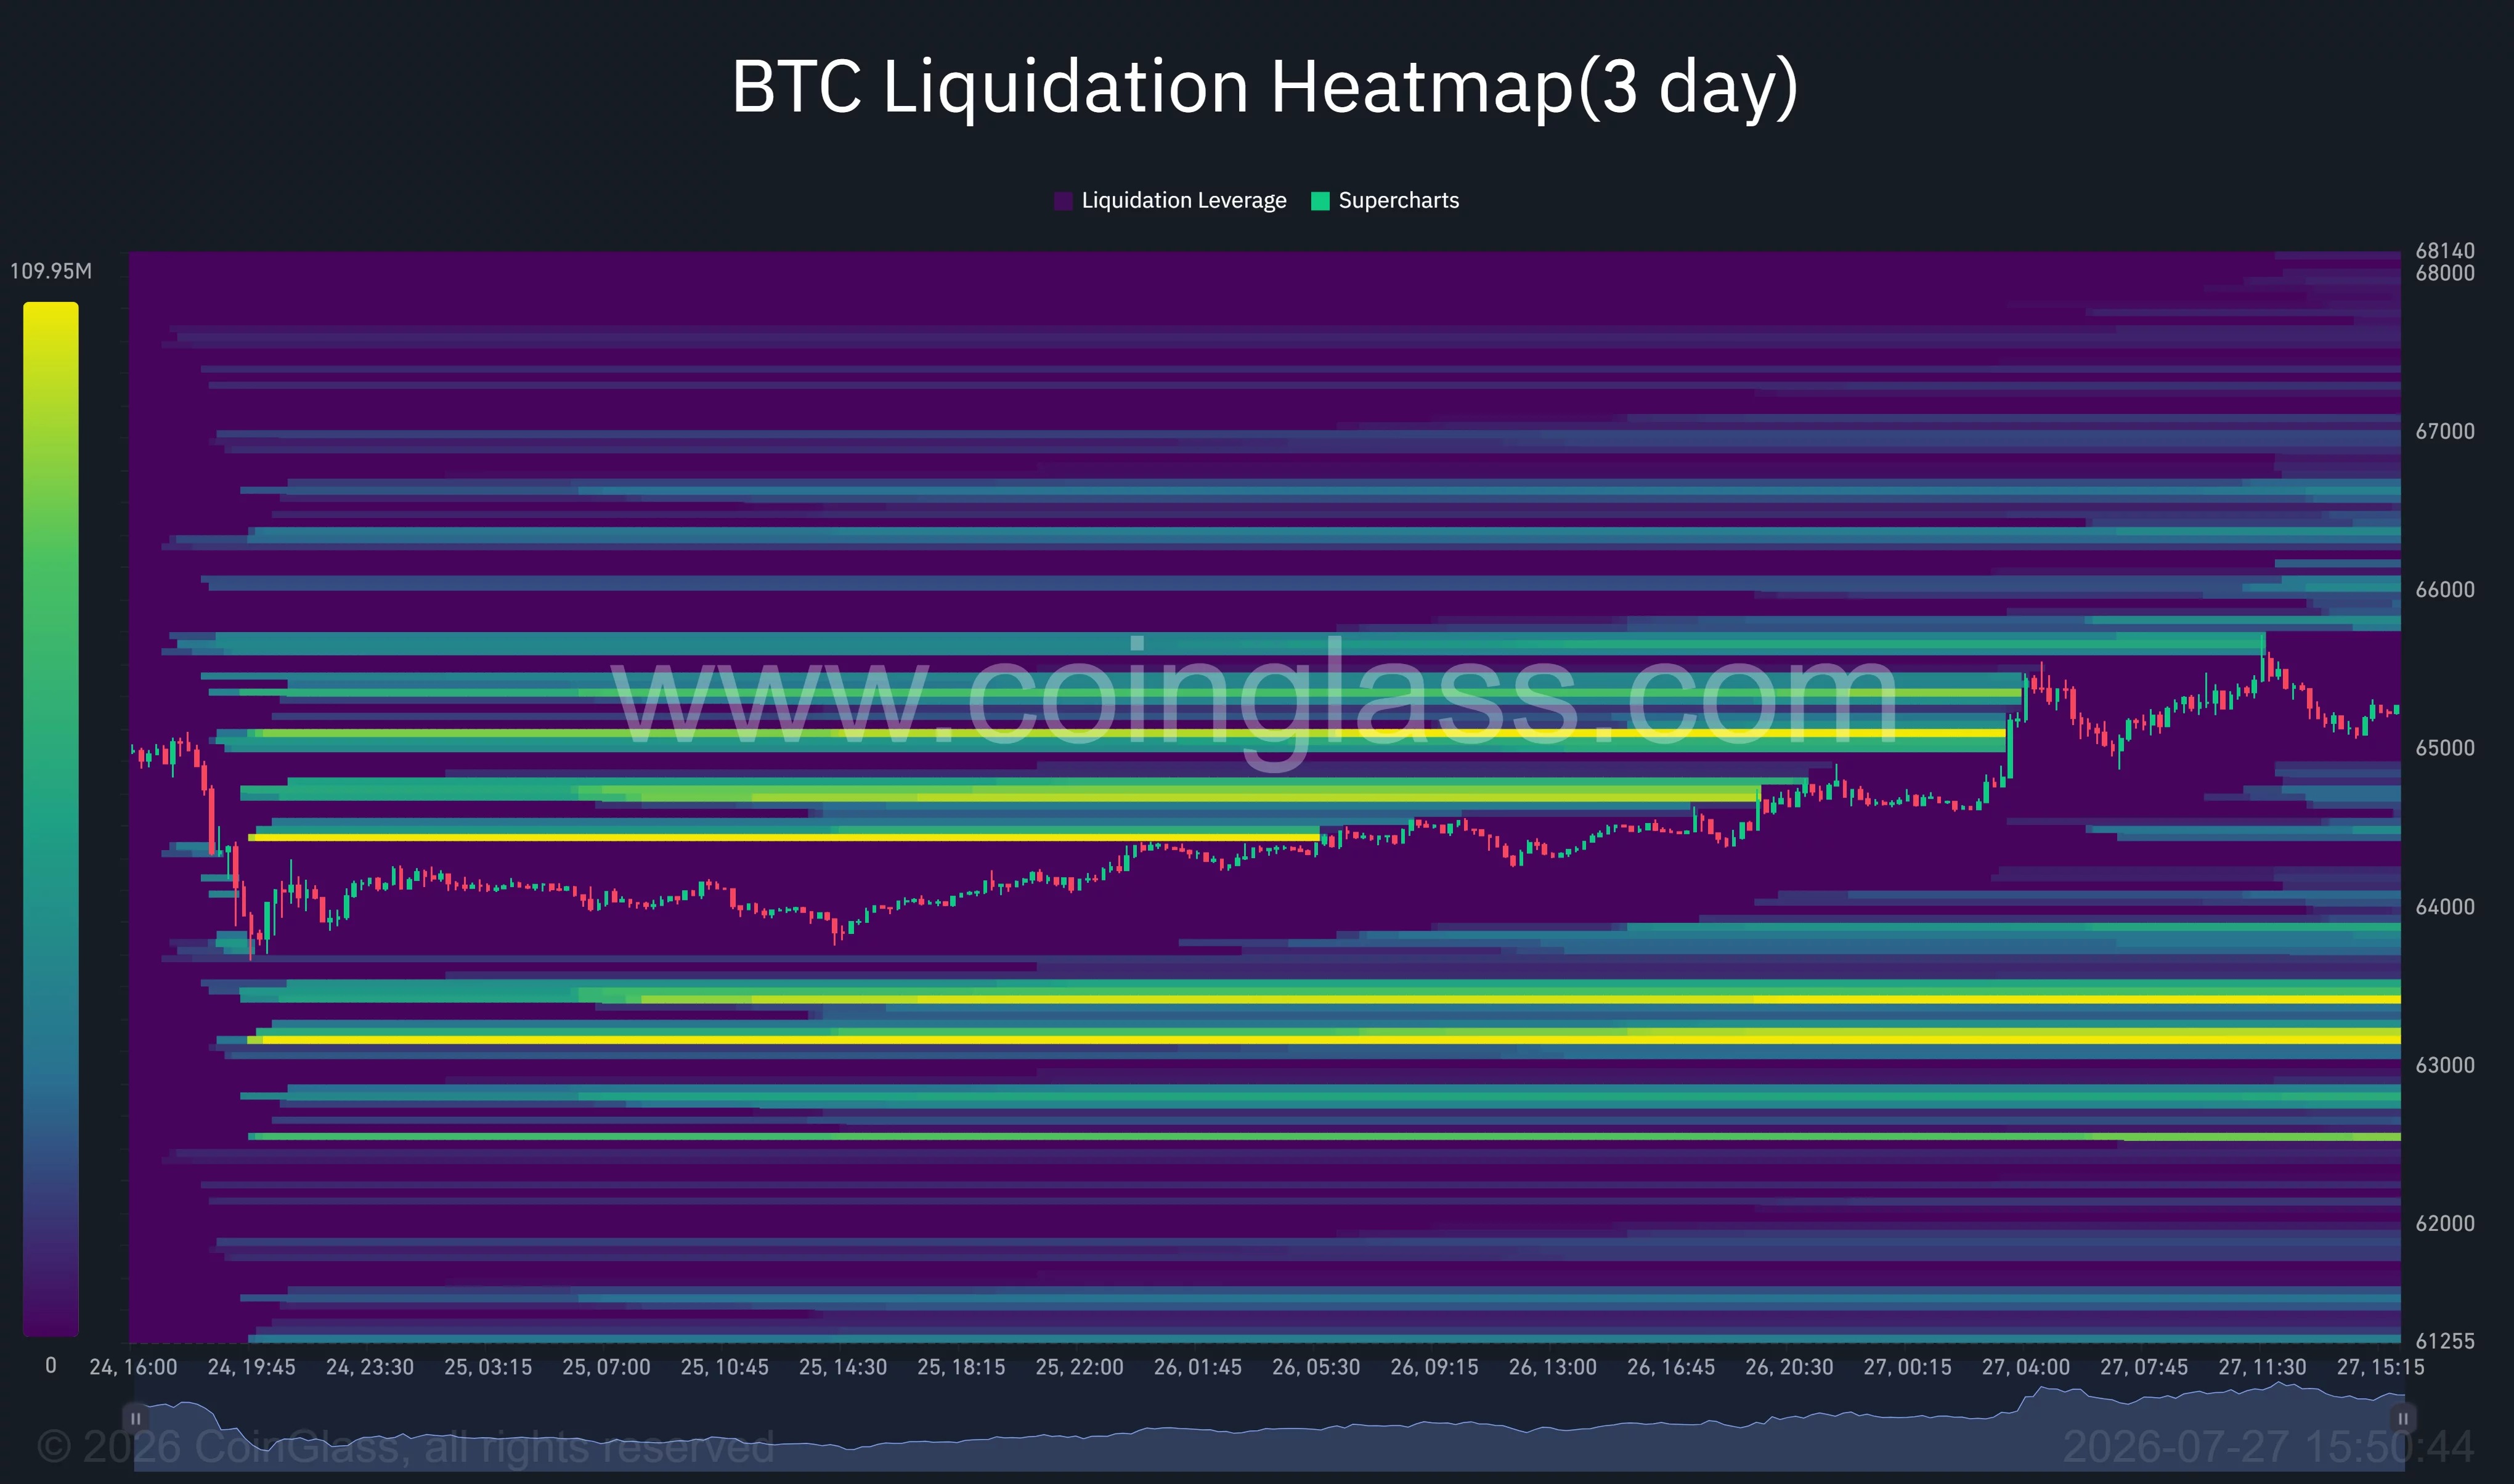
Looking at the downside, if Bitcoin falls below $64,000, the $63,000 to $63,500 area could re-emerge as a major support zone. Larger support lies around $61,506. If weekend gains are reversed, or if the situation in the Middle East deteriorates again, the market may retest these levels.