











What are altcoins? According to CoinMeta data, as of press time, the Altcoin Season Index is only 38-44, far below the 75 threshold for confirming an "altseason." Bitcoin dominance remains in the 55.56%-60.3% range. Among the 15 buyback-focused tokens tracked by DWF Labs, 13 have outperformed BTC, while Bitcoin fell about 8.5% over the same period. When the "altseason" is slow to arrive, which six altcoins have the most market potential?
What Are Altcoins?
Altcoins broadly refer to all cryptocurrencies other than Bitcoin. But the reality in 2026 is: the total market cap of altcoins is about $1.22 trillion, accounting for 42.62% of the crypto market. Among them, only 84 have a market cap exceeding $1 billion. The Altcoin Season Index is only 37-44, far below the 75 threshold for an "altseason," and Bitcoin dominance remains above 60%. Over the past 90 days, only about 25%-35% of altcoins have outperformed BTC.
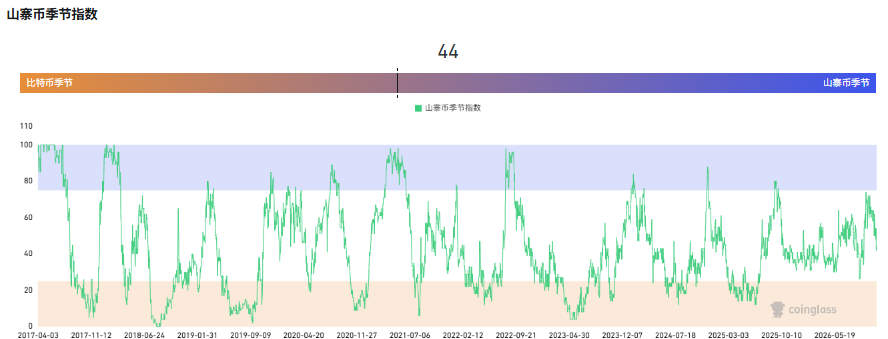
From a longer-term perspective, among the 1,972 tokens that first surpassed $50 million in circulating market cap since 2020, only 4.1% ultimately outperformed Bitcoin as of June 2026. A broad-based altseason has not arrived under the current structure.
What Is the Selection Logic for Altcoins in 2026?
From the analysis above, we can see that since 2025, the market cap share of the top ten altcoins has suddenly jumped from a long-stable 69%-73% range to 82%. The share of Meme coin market cap in the total altcoin market cap has fallen from over 10% in the early stages of this bull market to about 3%, hitting a historic low.
Against this backdrop, what is the selection logic for altcoins in 2026? In our view, capital is withdrawing from purely sentiment-driven assets and shifting toward targets with verifiable revenue, real products, and buyback mechanisms.
Let's take a look at the six most promising altcoins.
| Coin | Reference Price Range | Suitable Scenario |
|---|---|---|
| ETH | Approx. $2,400–$3,600 | Investors seeking relatively low volatility |
| SOL | Approx. $120–$200 | Bullish on stablecoin settlement and high-frequency payment adoption |
| LINK | Approx. $14–$25 | Investors preferring infrastructure-type core positions |
| ARB | Approx. $0.20–$0.45 | Positioned as an RWA positioning allocation |
| TAO | Approx. $250–$320 | High risk appetite |
| HYPE | Approx. $30–$55 | Focusing on real protocol revenue and buyback loop |
Introduction to Six Promising Altcoins
Ethereum (ETH)
Key Point: Cash Flow Infrastructure for the L2 Settlement LayerAnalysis of ETH's Holding Value
In our view, Ethereum's value lies in collecting fees as the final settlement layer for tens of billions of dollars in L2 activity.The total value locked (TVL) in the Ethereum L2 ecosystem reached approximately $37.4 billion in 2026, almost equivalent to half of the mainnet TVL. The Pectra upgrade increased blob throughput, the Fusaka upgrade increased data availability by 8x, and median transaction fees dropped to a historic low of $0.008. It is fair to say that it is the lowest-volatility, most institutionally accepted core position option in an altcoin portfolio.
As of press time, Ethereum is quoted at $2,102.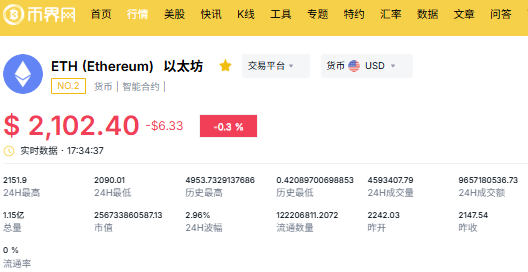
Solana (SOL)
Key Point: Execution Layer Premium from Independent ClientsAnalysis of SOL's Holding Value
In our view, the holding value of SOL is supported by the following data points:First, SOL ETFs: the total net assets of global spot Solana ETFs are approximately $1.9 billion, with cumulative net inflows of about $1.6 billion. The net inflows are highly close to net assets, indicating a high retention rate of incoming capital. Second, Firedancer is already running on the mainnet, with a single-client processing capacity of 1 million TPS in controlled stress tests, while the stable mainnet average is around 65,000 TPS.Additionally, Solana handled 76% of global stablecoin transfer volume in Q1 2026, with a stablecoin market cap of $14.85 billion, ranking third among public chains. In our view, these three data points are sufficient to demonstrate SOL's holding value.
As of press time, SOL is quoted at $85.41.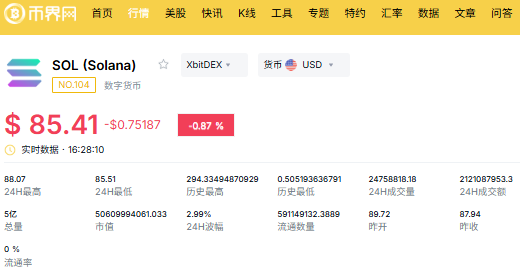
Chainlink (LINK)
Key Point: The Toll Road for Cross-Chain Value TransferAnalysis of LINK's Holding Value
Unlike SOL, which realizes value through execution layer throughput and payment flows, LINK's holding value lies in another dimension:It does not directly carry transactions but serves as critical infrastructure.Chainlink's Q3 2026 quarterly report shows that CCIP secures over $85 billion in cross-chain value, with $15 billion in migration volume in 2026. As of February 2026, about 28.5% of circulating LINK is staked, more than double the 12% at the beginning of 2025. Our analysis suggests that the doubling of the staking ratio means LINK's circulating supply is being systematically compressed, while the binding relationship between token holders and network security is deepening.As of press time, LINK is quoted at $10.62.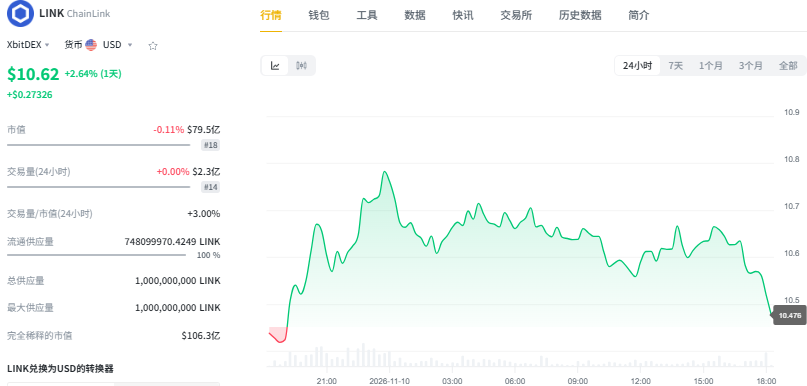
Arbitrum (ARB)
Key Point: The L2 Hub with the Most RWA DeploymentsAnalysis of ARB's Holding Value
Arbitrum ranks first in the number of RWA tokenization deployments, with over 4,500 deployed assets and an AUM of $1 billion. Network TVL is approximately $11.18 billion, total RWA tokenization value exceeds $3.8 billion, and tokenized stocks exceed $200 million with doubled growth. It processed 478 million transactions in the first half of 2026, with an ecosystem GDP of $206 million.As of press time, ARB is quoted at $0.167.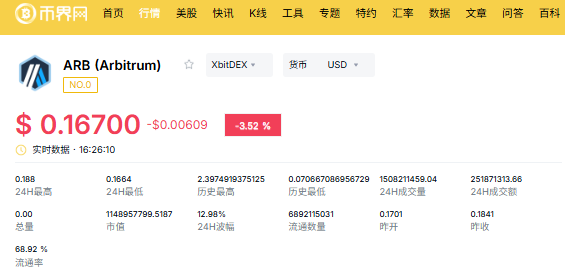
Bittensor (TAO)
Key Point: The Verifiable Revenue Experiment of the AI Subnet EconomyAnalysis of TAO's Holding Value
According to the SubConnect revenue index, TAO's revenue-generating subnets have doubled their annualized revenue from $35 million to $70 million in two months. This is the key differentiator between TAO and most AI-concept tokens. In Q1 2026, Nvidia invested $420 million into TAO, about 77% of which is staked and locked; Polychain Capital added $200 million in exposure during the same period. Together, the two brought approximately $620 million in incremental institutional capital to the network. Additionally, spot ETFs from Grayscale and Bitwise are awaiting approval.As of press time, TAO is quoted at $220.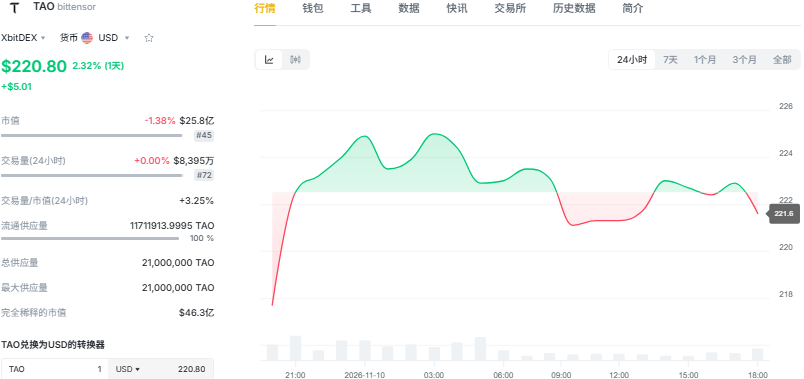
Hyperliquid (HYPE)
The DeFi Cash Flow Machine with the Highest Buyback IntensityAnalysis of HYPE's Holding Value
Currently, Hyperliquid's cumulative protocol revenue exceeds $1.4 billion, of which over $1.26 billion has been used to buy back HYPE from the market. The AQAv2 framework passed with 69.08% validator support, directing 90% of the yield from approximately $5 billion in USDC reserves toward HYPE buybacks. Combined with trading fee buybacks, the annual buyback scale could theoretically reach over $900 million.In our view, HYPE is the clearest case of a "revenue—buyback—token value" closed loop among altcoins in 2026, but it should be noted that its buyback scale is highly tied to protocol revenue.As of press time, HYPE is quoted at $74.16.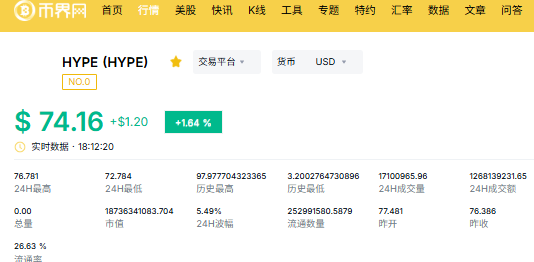
Conclusion
The definition of altcoins has narrowed in 2026: it is no longer "everything other than Bitcoin," but a shortlist of projects that can stand firm on real revenue or irreplaceable positioning under the suppression of 55%-60% Bitcoin dominance and an Altcoin Season Index of 38-44. In our view, the common feature of these six projects is not the size of their narratives, but whether there is a verifiable mechanism for value return.
FAQ
Q1: Has the altseason arrived?
Not yet. The latest Altcoin Season Index is between 38-44, Bitcoin dominance remains near 55%-60%, and capital has not flowed into altcoins on a large scale. It is still "Bitcoin season" rather than a full-blown altseason.
Q2: Will Bitcoin dominance keep suppressing altcoins?
In the short term, yes. Under CoinMarketCap's methodology, Bitcoin dominance is about 60.3%, the Altcoin Season Index is only 40, and the proportion of top 100 coins outperforming BTC is far below 75%.
Q3: Are there many altcoins outperforming Bitcoin right now?
Very few. Among the 15 buyback-focused altcoins tracked by DWF Labs, 13 outperformed BTC in 2026, while Bitcoin fell about 8.5% over the same period; HYPE rose over 200%, and PUMP rose over 120%.
Disclaimer: Readers are strictly advised to comply with local laws and regulations. This article is compiled based on public market data for reference and educational purposes only, and does not constitute investment advice.