











Cricut The stock shows a predominantly bullish daily chart structure, but the overbought readings indicate that it is important to distinguish between the trend and the entry point. The hourly chart supports the bullish judgment on the daily chart. However, the 15-minute MACD provides contradictory short-term signals; therefore, the bullish scenario depends on whether the support level can be held after trading resumes.

Key Points
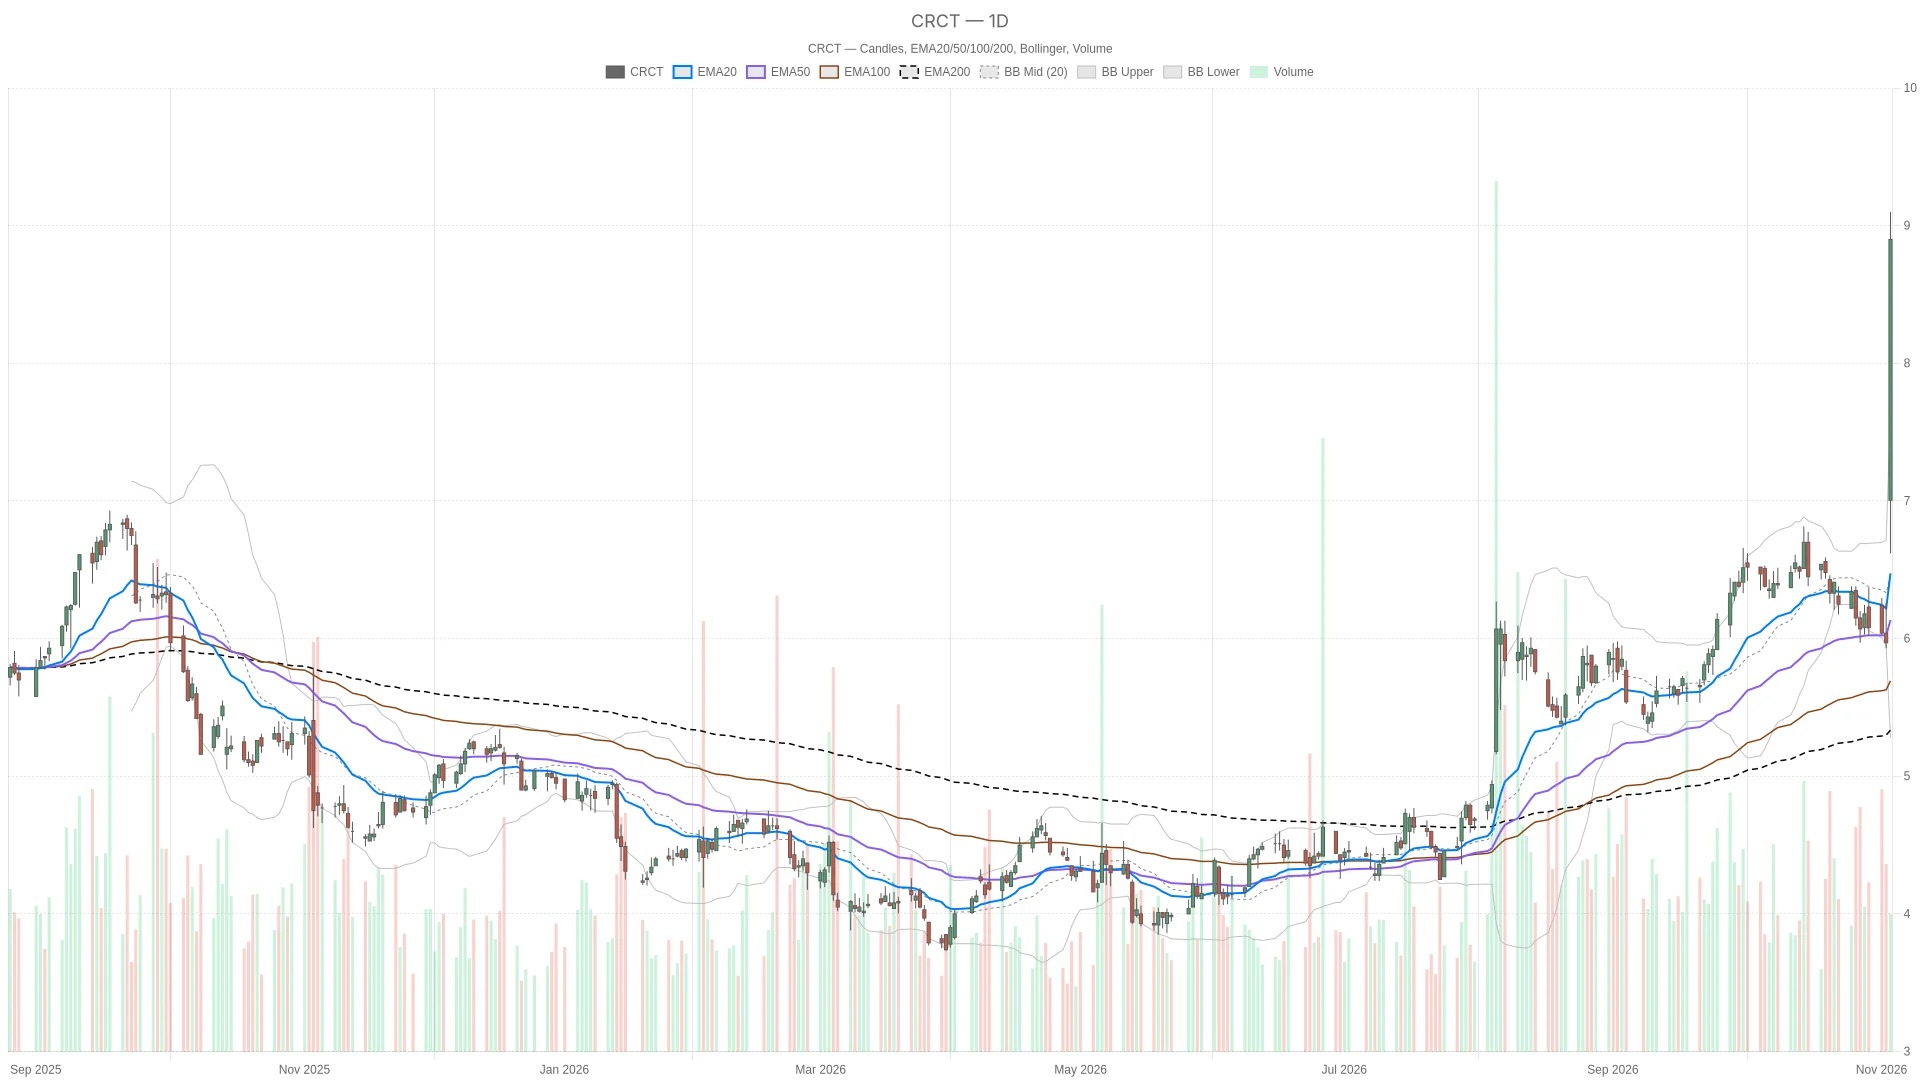
- The daily line RSI14 is at 82.07, which is in an overbought range; the daily line MACD is at 0.2, which is higher than the signal line of 0.09, and the bar chart shows a positive value of 0.11.
- The closing price is higher than the 20-day EMA of $6.47, the 50-day EMA of $6.14, and the 200-day EMA of $5.33; the moving averages are in a bullish alignment.
- The hourly chart RSI14 shows a value of 81.95, which is also in the overbought range; on the hourly chart, the bar chart for MACD shows a value of 0.27, and the line for MACD at 0.73 is higher than the signal line at 0.46.
- The daily line ATR14 is at $0.44, higher than the previous trading day's $0.23; the pivot point for the next trading day is $8.21, with the first resistance level at $9.79 and the first support level at $7.31.
On Wednesday, November 4, 2026, Cricut opened at $7, reached a low of $6.62 during the session, a high of $9.10, and closed at $8.90. The stock rose by 49.08% from its previous closing price, with a trading volume of 500,964 shares on that day. Cricut opened at $7.00 and fluctuated between $6.62 and $9.10 during the session, closing at $8.90, compared to a previous closing price of $5.97.
Cricut Background of Stock Financial Reports
A report released by Yahoo Finance before the opening on Wednesday indicated that Cricut's revenue increased by 11% in the third quarter, reaching $188.6 million. The report mentioned that international sales and new product launches provided support, but consumer prospects are cautious, and profit margins in the fourth quarter may be under pressure.
The daily chart shows a pattern of excessive buying.
The closing price of $8.90 is higher than the 20-day moving average of $6.47, the 50-day moving average of $6.14, and the 200-day moving average of $5.33. The price is in a bullish alignment with these moving averages, which supports a mainly bullish outlook rather than a neutral interpretation.
However, the daily line RSI14 is at 82.07, which is clearly in an overbought zone. The daily line MACD is at 0.2, higher than the signal line of 0.09, and the bar chart shows a positive value of 0.11. MACD indicates a bias towards support, while RSI warns that this direction should not be simply regarded as an unconditional entry signal.
The closing price is also higher than the upper band of the daily Bollinger Bands at $7.64; the middle band is $6.46. In other words, the price is now outside the upper band, not just above the moving average. The daily ATR14 has risen from $0.23 to $0.44, indicating higher volatility compared to the previous daily candlestick.
Hourly chart confirmed, but execution signals are mixed.
The hourly chart confirms the bullish judgment from the daily chart, with the closing price above the 20-hour EMA level of $7.44, the 50-hour EMA level of $6.79, and the 200-hour EMA level of $6.34. This arrangement also presents a bullish structure. The hourly RSI14 level is at 81.95, which is also in an overbought zone, yet the price is still below the upper band of the hourly Bollinger Bands at $9.61.
However, on the hourly chart, the MACD bar chart has dropped from 0.29 to 0.27. It is still positive, and the MACD line at 0.73 is still above the signal line at 0.46. The bullish relationship still exists, but the change in the bar chart has somewhat diminished the strength of the originally strong hourly chart image.
On the 15-minute chart, RSI14 dropped from 72.87 to 69.51, below the overbought threshold. The MACD line is at 0.36, which is lower than the signal line of 0.45, and the bar chart shows a negative value of -0.09. In contrast, the closing price is still higher than the 15-minute 20-period EMA of 8.59 dollars and the middle band of the Bollinger Bands at 8.85 dollars. These mixed signals make the timing of execution more complex, but they do not overturn the overall bullish judgment for the daily chart.
Cricut Stocks: Key Prices for the Next Trading Day
For the next trading day, the daily pivot point is at $8.21, with the first resistance level at $9.79 and the first support level at $7.31. The hourly pivot point is at $8.91, with the first resistance level at $9.08 and the first support level at $8.73. The 15-minute pivot point is at $8.92, with the first resistance level at $9.00 and the first support level at $8.82. These are forward-looking reference levels for when trading resumes.
The scenario requires that the price remains above the daily pivot point of $8.21. If it can break through the hourly pivot point of $8.91 and the 15-minute pivot point of $8.92, it will strengthen the short-term confirmation. Further resistance levels are the first 15-minute resistance level at $9, the first hourly resistance level at $9.08, and the intraday high of $9.10. A higher-level reference point is the first daily resistance level at $9.79.
On the contrary, if it falls below the 15-minute first support level of $8.82 and the hourly first support level of $8.73, the execution conditions will weaken. If it falls below the daily pivot point of $8.21, the current bullish continuation scenario will be undermined. Further down, the upper band of the daily Bollinger Bands at $7.64 and the daily first support level at $7.31 will become relevant downward references.
Overall, the stock price of Cricut is higher than the daily moving average and the pivot point of the next trading day, but lower than the nearby hourly and 15-minute pivot points. The daily ATR14 is at $0.44, highlighting the volatile context. The unresolved question is whether these nearby resistance levels can be broken through, given that both the daily and hourly RSI are in overbought conditions.
Frequently Asked Questions
Which key price levels of the Cricut stock need to be watched on the next trading day?
The daily pivot point is $8.21, with the first resistance level at $9.79 and the first support level at $7.31. The hourly pivot point is $8.91, with the first resistance level at $9.08 and the first support level at $8.73. The 15-minute pivot point is $8.92, with the first resistance level at $9.00 and the first support level at $8.82.
Cricut Is the stock in a overbought state?
The daily line RSI14 is at 82.07, the hourly line RSI14 is at 81.95, both of which are above 70, indicating an overbought area. The 15-minute line RSI14 is at 69.51, which is below the overbought threshold.
Cricut What is the daily trend structure of the stock?
The closing price of $8.90 is higher than the 20-day moving average of $6.47, the 50-day moving average of $6.14, and the 200-day moving average of $5.33. The moving averages are in a bullish alignment, which supports a bullish outlook.
What does MACD indicate on different time frames?
On the daily chart, the MACD line is at 0.2, which is higher than the signal line of 0.09; the bar chart shows a value of 0.11. On the hourly chart, the MACD line is at 0.73, which is higher than the signal line of 0.46; the bar chart shows a value of 0.27. On the 15-minute chart, the MACD line is at 0.36, which is lower than the signal line of 0.45; the bar chart shows a value of -0.09.
This article is for informational purposes only and does not constitute financial advice, investment recommendations, or an offer to buy or sell any financial instruments. The analysis provided does not represent future results. Investments in the financial market carry a high risk of principal loss. Before making any decisions, please conduct your own research ( DYOR ) and consult a qualified financial advisor.
Cryptonomist and the author do not hold any positions in the financial instruments mentioned in this text, nor have they received any compensation from the companies reported.
This article was generated with the assistance of artificial intelligence and has been reviewed by an editorial team.
Lorenzo Marcek is a financial journalist and senior crypto market analyst, known for his clear, data-driven reporting on digital assets. With a background in economics and over a decade of experience covering global markets, he specializes in on-chain indicators, institutional adoption trends, and macroeconomic factors that influence cryptocurrency prices. His work combines investigative journalism with technical market insights, making him a trusted source for traders seeking solid, actionable analysis.