















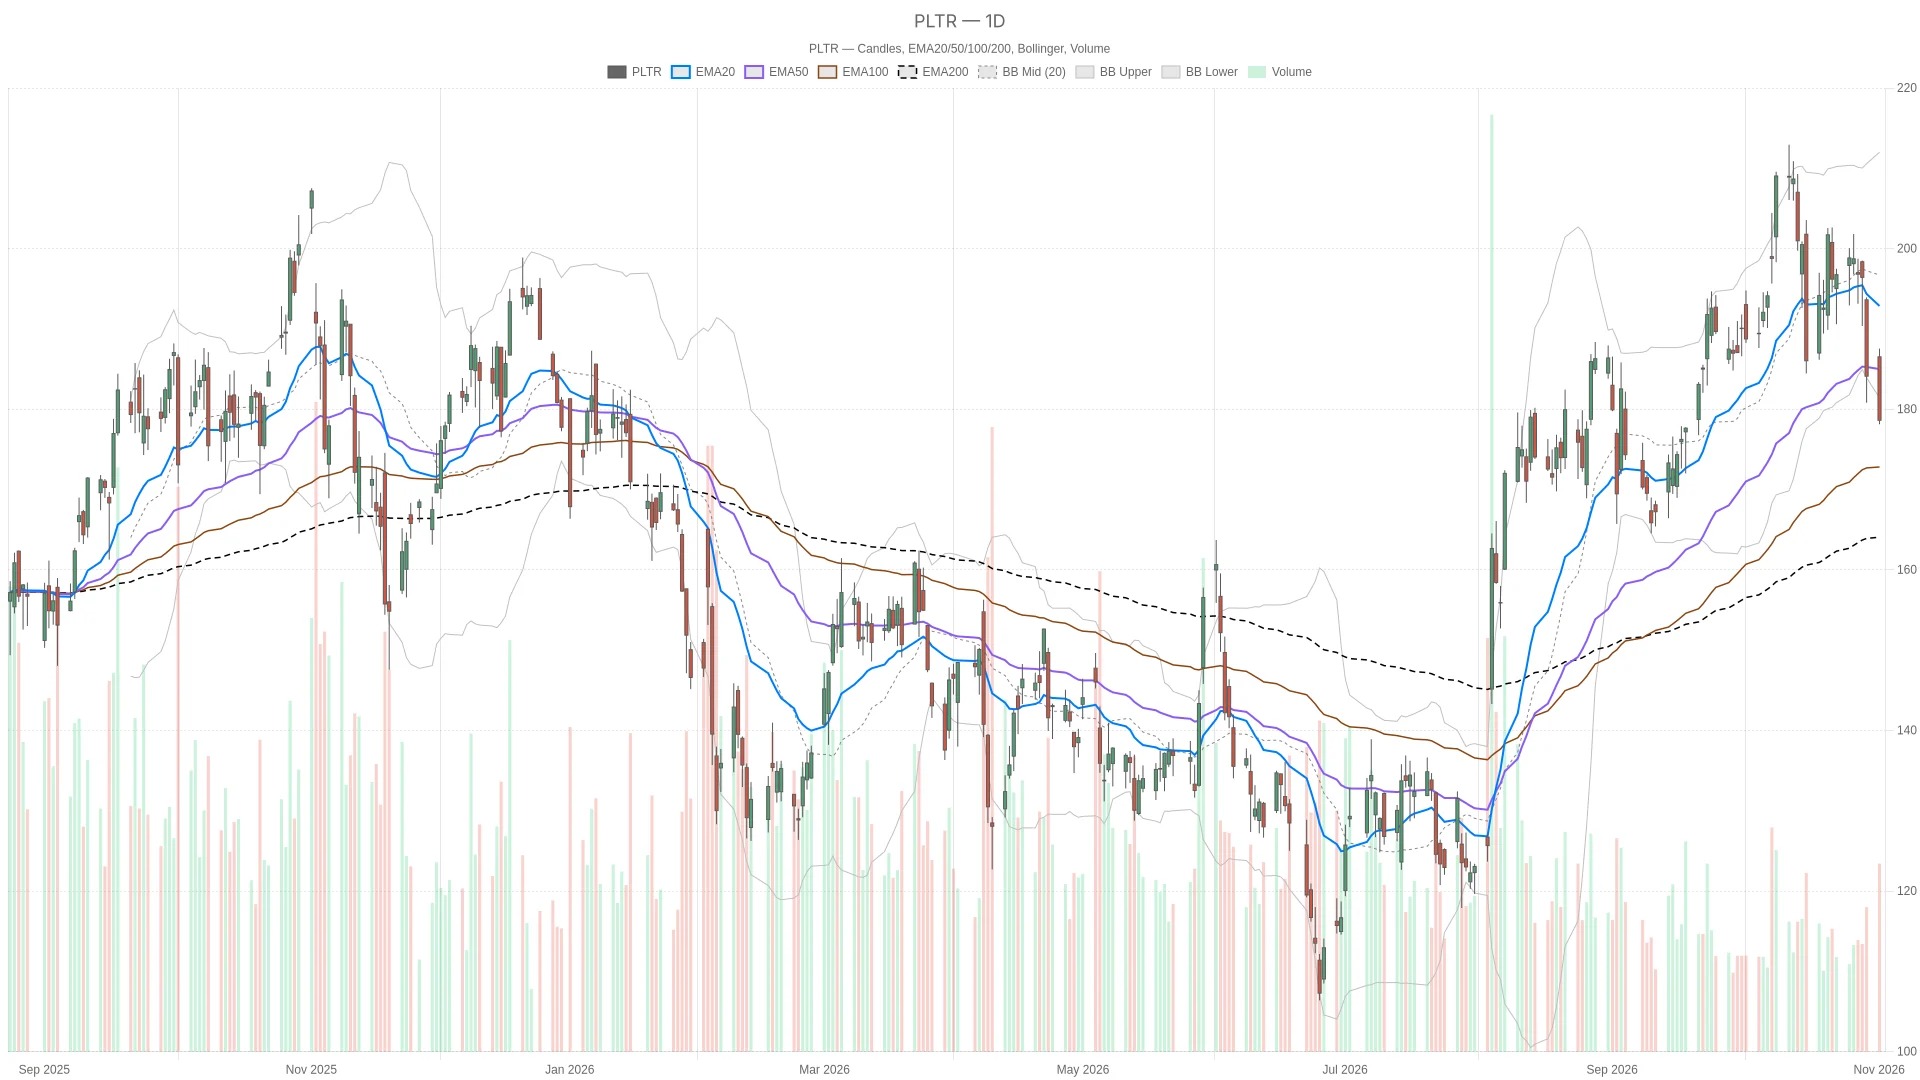
Palantir Closed at $178.62 on Monday, below its 20-day and 50-day moving averages, but still above the 200-day EMA.

The hourly chart also shows the same suppression by the upper moving average, and short-term indicators have entered an oversold zone, making the short-term outlook more complex.
Key Points
- Palantir closed at $178.62 on Monday, a decrease of 2.98% from the previous closing price of $184.11 on October 30, 2026.
- The closing price was below $192.85 for 20 trading days EMA and below $185 for 50 trading days EMA, but above $161.79 for 200 trading days EMA.
- The daily line RSI14 is at 37.91; the daily line MACD is at 0.58, the signal line is at 3.25, and the bar chart shows -2.67.
- The hour RSI14 is 26.37, and the 15-minute mark RSI14 is 21.12.
- The daily pivot point for the next trading day is $181.43, with the first resistance level at $184.74 and the first support level at $175.32.
Palantir The daily chart maintains a bearish pattern.
Palantir closed at $178.62 on Monday, November 2, 2026, which is lower than the $192.85 level seen over 20 trading days and the $185 level observed over 50 trading days.
On Monday, the stock opened at $186.52, hit a low of $178.13 during the session, and closed at $178.62. Compared to the previous closing price of $184.11 on October 30, 2026, it fell by 2.98% on that day.
Both of these moving averages are above $161.79, which represents 200 trading days EMA, and the stock price is still higher than this longer-term moving average. Such a combination indicates a short-term bearish trend, but a complete bearish alignment between prices and moving averages has not yet been formed.
Daily Momentum Indicator
The daily line RSI14 is at 37.91, which is below the neutral level, but it has not yet entered the oversold range. Meanwhile, the MACD line is at a positive value of 0.58, but it is below the signal line of 3.25.
Its negative value bar chart at -2.67 supports a tendency towards weakness, although the MACD line is still above the zero axis.
Bollinger Bands and ATR14
It is worth noting that the closing price was below the lower band of the daily Bollinger Bands at 181.42 USD. The middle band at 196.71 USD and the upper band at 212 USD are located above that.
Palantir Hourly Chart and Oversold Reading
The trading price is below the three-hour exponential moving average, while the hourly RSI14 is at 26.37, indicating an oversold zone.
The closing price was below the 20-hour EMA of $186.64, the 200-hour EMA of $190.55, and the 50-hour EMA of $191.21. The arrangement of these three moving averages is not entirely bearish, but they are all above the price level.
At the same time, the value at hour MACD is -3.69, which is lower than the signal line of -3.12, and the value on the bar chart is -0.57. From this, there is a bias towards a bearish trend. However, the value of 26.37 at hour RSI14 complicates short-term timing decisions, but it does not overturn the judgment at the daily time frame.
15-minute execution environment
On the 15-minute chart, the price is below the 20-week EMA of $182.45, the 50-week EMA of $185.12, and the 200-week EMA of $191.13. Its RSI14 is also in an oversold range, at $21.12.
Palantir Financial reporting is limited to periods outside of completed transactions.
The financial report coverage for Palantir includes forecasts released before the market opened on Monday, as well as a report published by CNBC after the market closed on Monday.
In addition, a report released by CNBC after the close on Monday indicated that commercial revenue increased by 148% year-on-year, reaching $984 million, surpassing government revenue of $953 million.
Next trading day's Palantir key levels
For the next trading day, the daily pivot point is at $181.43, the first resistance level is at $184.74, and the first support level is at $175.32. These levels are calculated based on the completed daily candlestick charts.
Excessive conditions
To form a bullish scenario, the price needs to first retest below the lower band of the daily Bollinger Bands at 181.42 USD, and then above the pivot point of the next trading day at 181.43 USD. If it further breaks through the first resistance level of 184.74 USD and the 50-day moving average at 185 USD, that will provide stronger confirmation of the upward trend.
For 20 trading days, $192.85 is the upper threshold. EMA
Empty condition
On the contrary, if it falls below today's low of $178.13, that would weaken the aforementioned bullish scenario. The first support level on the daily chart for the next trading day, which is $175.32, would then become the reference point below that.
The oversold readings on the hourly and 15-minute charts themselves do not negate this bearish scenario. Overall, Palantir is below the lower band of the daily Bollinger Bands and key short-term moving averages, but it is still above the 200-day EMA. The daily ATR14 is at $8.36, reflecting a range of volatility. Whether the price can once again rise above $181.42 and $181.43 remains uncertain.
Frequently Asked Questions
Palantir What is the closing price on Monday?
The closing price was $178.62, with a range during the session of $178.13 at the lowest and $187.55 at the highest. Compared to the previous closing price of $184.11 on October 30, 2026, there was a decline of 2.98%.
Palantir What are the key levels for the next trading day?
The daily pivot point is $181.43, the first resistance level is $184.74, and the first support level is $175.32, all calculated based on the completed daily candlestick charts.
Palantir Is it higher than the long-term moving average?
Yes. The closing price of $178.62 is higher than the 200-day moving average of $161.79, and it has also been above this level for 20 trading days ($192.85) and 50 trading days ($185).
What do the in-market indicators show?
The hour RSI14 is at 26.37, and the 15-minute RSI14 is at 21.12, both of which are in an oversold range; the hour MACD line is at -3.69, which is lower than the signal line of -3.12.
Cryptonomist and the author do not hold any positions in the financial instruments mentioned in this text, nor have they received any compensation from the companies reported.
This article was generated with the assistance of artificial intelligence and has been reviewed by an editorial team.
Lorenzo Marcek
Lorenzo Marcek is a financial journalist and senior crypto market analyst, known for his clear, data-driven reporting on digital assets. With a background in economics and over a decade of experience covering global markets, he specializes in on-chain indicators, institutional adoption trends, and macroeconomic factors that influence crypto market volatility. His work combines investigative journalism with technical market insights, making him a trusted source for traders seeking solid and actionable analysis.