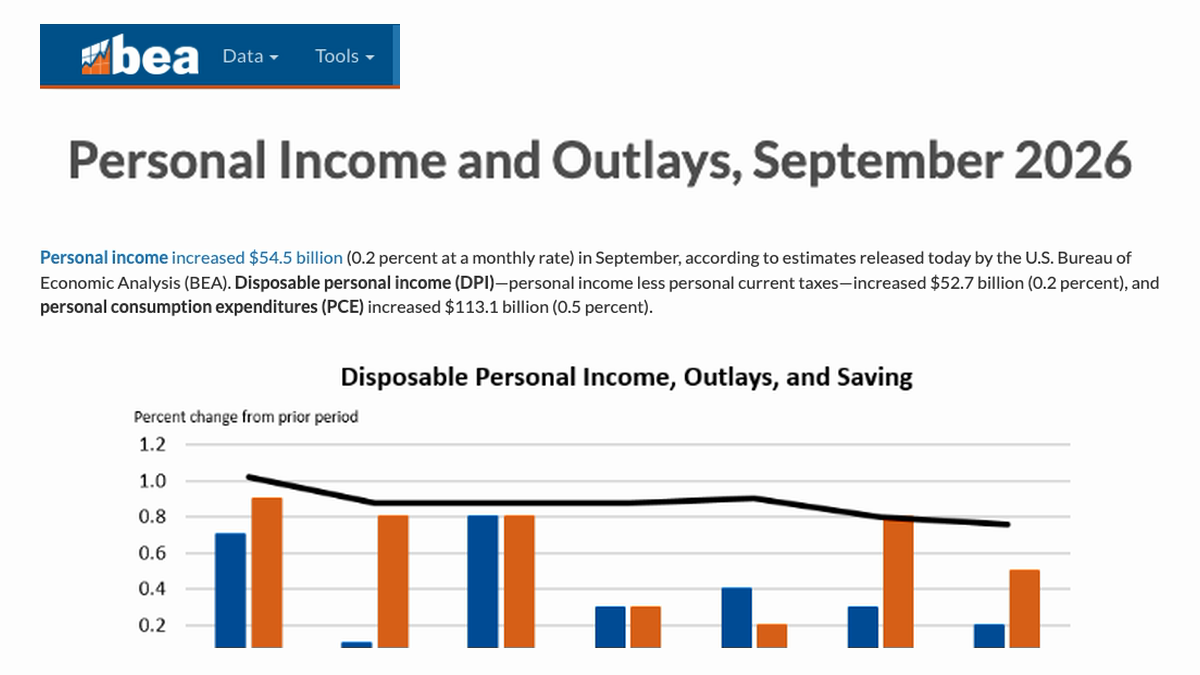













U.S. residents continued to see an increase in nominal consumption amounts in September, but after adjusting for price changes, the actual volume of new purchases remainedほぼ unchanged. On October 29th, the Bureau of Economic Analysis (BEA) announced that personal consumption expenditures increased by $113.1 billion at current month's prices, representing a 0.5% month-on-month rise; however, the real (inflation-adjusted) consumption only increased by $2.6 billion, with a monthly growth rate of less than 0.1%. The gap between the increase in nominal amounts and the actual volume indicates that a significant portion of that month's consumption expansion was due to price changes.
Personal income increased by $54.5 billion during the same period, a month-on-month increase of 0.2%; disposable personal income also rose by $52.7 billion, an increase of 0.2%. When the growth rate of consumer spending exceeds that of disposable income, households need to make up for the difference from savings or other sources of funds. In September, personal savings amounted to $911.1 billion, with a savings rate of 3.8%.
All these figures come from the same set of national economic accounts, yet they are used for different purposes. Personal income includes wages, social welfare, and other earnings; disposable income is after deducting personal taxes; PCE records household expenditures on goods and services. It is not accurate to treat increases in income and increases in expenditure as the cash flows of the same group of households, but the overall differences can still indicate the direction of pressure faced by the household sector in that month.
More money was spent on goods and services, but the actual quantity was consumed by the high prices.
Of the nominal increase of $113.1 billion in PCE, expenditure on goods increased by $35.1 billion, and expenditure on services increased by $78.1 billion. There is a rounding difference when these two amounts are added together. Just because it appears that services contributed more does not necessarily mean that the actual consumption of services has increased more, as the price changes for various categories are not the same.
In September, the PCE price index rose by 0.5% month-on-month, higher than the 0.3% increase in August; after excluding food and energy, the core PCE price index rose by 0.3%. Year-on-year, the total PCE price index increased by 3.6%, and the core index by 3.1%. The price increases that month accounted for most of the difference between nominal and real expenditures.
Actual disposable personal income decreased by 0.3% month-on-month, further indicating that the growth in nominal income did not offset the impact of prices. The term “actual” here refers to the overall purchasing power after statistical adjustments, and it does not mean that every household’s income decreased by 0.3%. Different salaries, asset incomes, benefits, and consumption patterns can lead to significant differences in individual experiences.
A high consumption figure alone does not necessarily prove strong demand.
Nominal PCE has risen by 0.5%, which seems to indicate resilience, but the actual PCE increase is less than 0.1%, suggesting that price factors need to be separated out. If we judge a company's sales volume solely based on the amount spent by consumers, we may overestimate the growth in the quantity of goods or services; however, if we only look at the total actual amount, we will overlook the fact that households are indeed paying higher amounts.
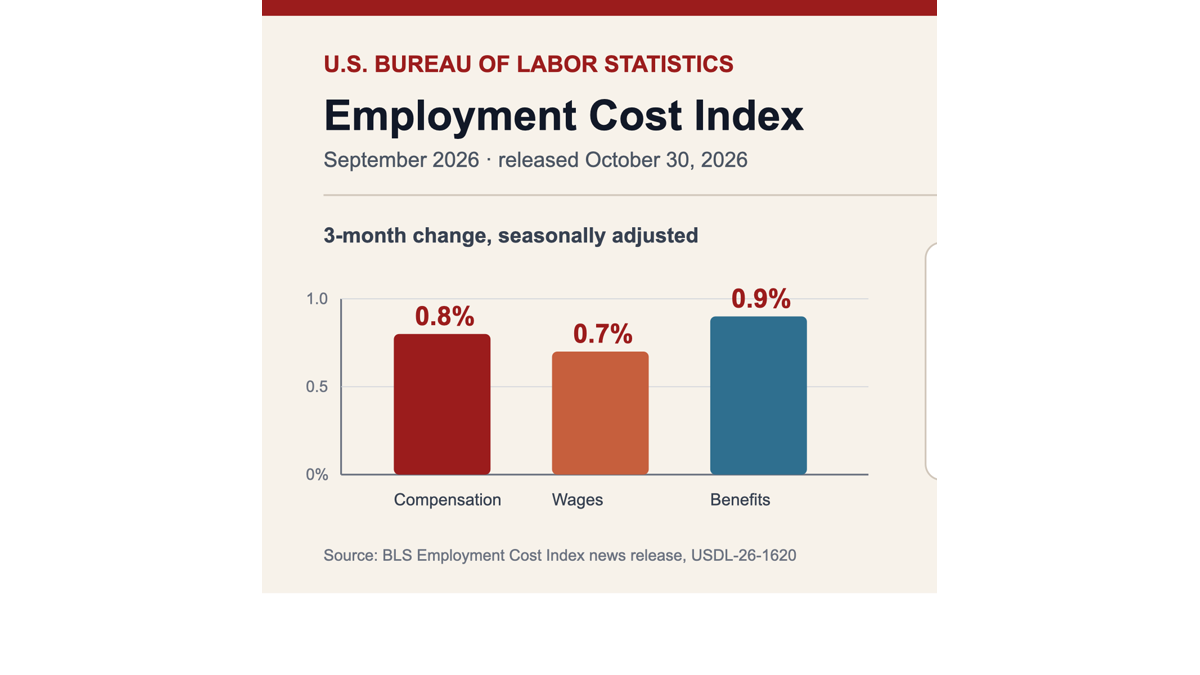
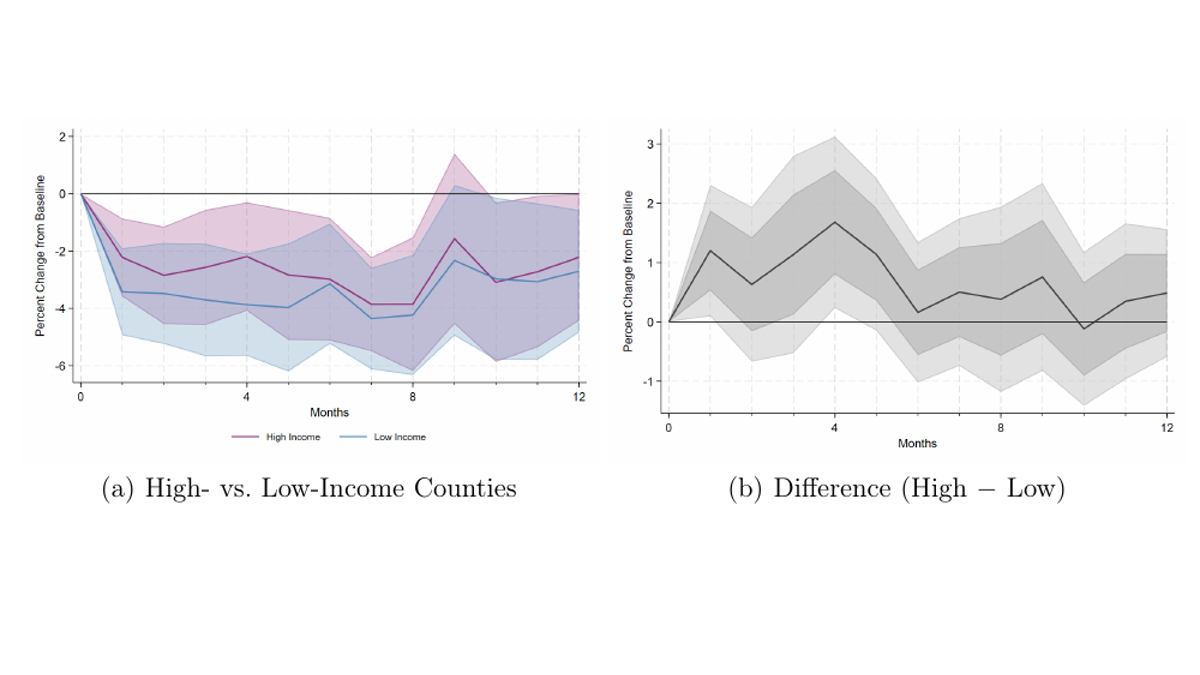
The $54.5 billion increase in revenue mainly came from employee compensation and government social welfare. The growth in compensation was driven by wages and salaries in the private sector, while the increase in social welfare was primarily due to medical insurance-related programs. Officials have not broken down these totals by income bracket, so it is not possible to determine which groups, low-income or high-income families, contributed more to consumption based on this data.
This update also revised the personal income estimates for July and August, due to revisions in employment data from the Bureau of Labor Statistics, as well as new monetary interest information provided by the Financial Services Agency. The release of macroeconomic data is not a set-in-stone record; subsequent information may change the figures for earlier months. When making one-month transactions or budgets, it is necessary to leave room for such revisions.
The next set of personal income and expenditure data for October is scheduled to be released on November 25th. What can be confirmed for now is that in September, the nominal expenditure of households exceeded their nominal disposable income, the price index accelerated, real consumption remained relatively unchanged, and the savings rate stood at 3.8%. For retail and service businesses, this means that revenue growth did not correspond to a corresponding increase in sales; for households, the rise in bills was not offset by an equivalent improvement in real income.
The PCE price index remains an important indicator for the Federal Reserve to monitor inflation, but this time, the year-on-year total index of 3.6% and the core index of 3.1% cannot directly replace the Consumer Price Index. The two sets of statistics differ in the weights of the commodities included, the treatment of medical expenditures, and the methods of updating. When observing an increase or decrease in an index, it is necessary to first confirm that the comparison is based on the same criteria and the same time period.
When enterprises conduct demand forecasting, they also need to break down the additional $35.1 billion in goods and $78.1 billion in services into actual quantities. Nominal sales can help determine cash income, while the actual PCE is closer to the volume of economic activity; when both slow down or deviate at the same time, it has different implications for inventory management, pricing, and staffing arrangements.