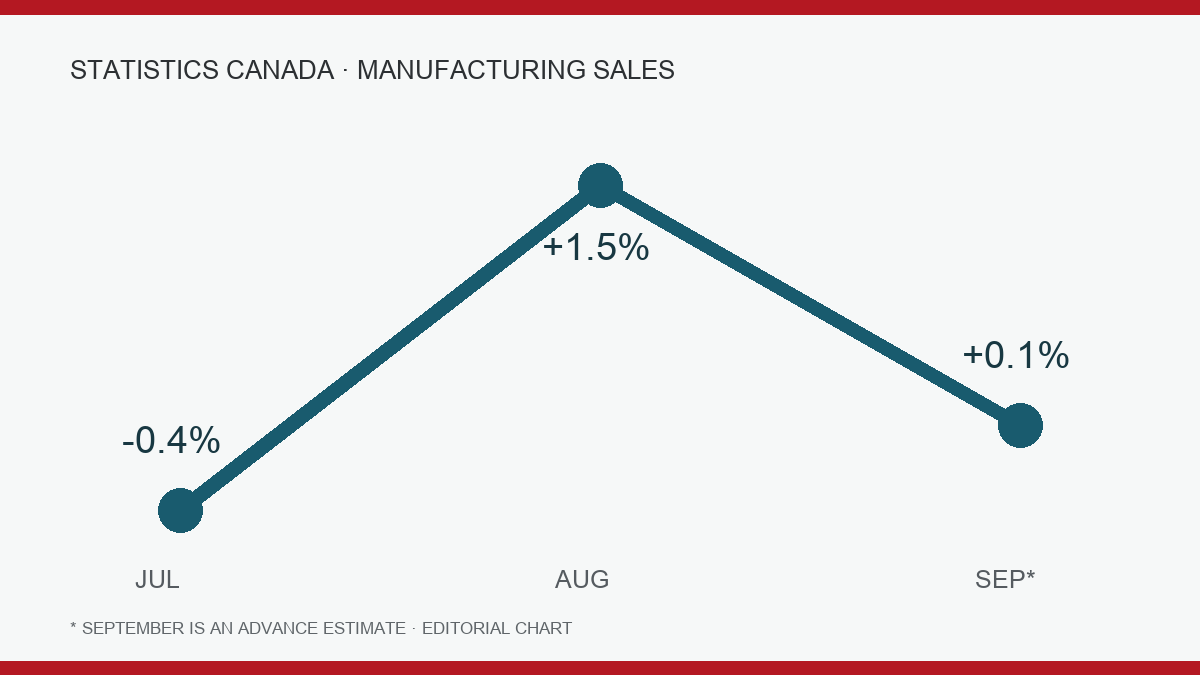












On October 23, Statistics Canada released a preliminary estimate of manufacturing sales for September: seasonally adjusted sales volume increased by a modest 0.1% month-on-month. Oil and coal products, as well as aerospace products and components, were among the sectors with larger growth. This figure may set the tone for the industrial outlook, but it's important to note the word “preliminary” in the report title. It is not the final official monthly estimate for September’s manufacturing sector; the latter is expected to be released on November 13 based on more complete data.
The preliminary estimated weighted response rate for this time is 71.3%, while the average response rate at the time of the final release of the survey in the past 12 months was 92.4%. This gap does not indicate an error in the calculations by the statistical bureau, but rather suggests that there is still a portion of corporate data that has not been received or verified. The statistical bureau has clearly pointed out that preliminary indicators are more prone to revision than the regular monthly releases. Therefore, the most appropriate way to describe “0.1% sales growth” is as “preliminary estimates show a slight increase,” and it should not be written as “manufacturing growth in September has been confirmed.” The closer the figure is to zero, the more cautious one should be about the possibility of subsequent revisions changing the direction.
Why is a slight increase still worth paying attention to?
0.1% may not seem like a significant figure, but it can provide an indication of the general trend in corporate orders, shipments, and price changes when the information at the beginning of the month is incomplete. Canada's manufacturing chain connects resources, transportation equipment, and export markets. Changes in the two leading sectors of oil and coal, as well as aerospace, may stem from completely different reasons. The nominal sales of energy products are affected by commodity prices, while the aerospace sector is often influenced by the pace of large-scale deliveries. Combining these factors and labeling them as "a general improvement in overall manufacturing orders" obscures the underlying structural differences.
According to the statistics bureau, the percentages are calculated based on seasonally adjusted current price data. Current price means that the sales amount does not take into account price factors; if the prices of petroleum products rise, nominal sales may increase, but the actual quantity sold may not necessarily increase accordingly. The purpose of seasonal adjustment is to reduce fluctuations that typically occur in a certain season, but it cannot eliminate all unexpected events. Therefore, to determine the actual output of factories, it is still necessary to consider industrial production, inventory, price indices, and subsequent constant-price sales data, and this 0.1% cannot be used as a substitute for the physical output of the manufacturing industry.
The purpose of leading indicators is to shorten the wait for official reports. Trade enterprises, industrial purchasers, and market analysts typically cannot wait until all surveys are completed before making judgments for the current month. Therefore, statistical bureaus form early estimates based on the surveys and administrative data that have already been received. These indicators provide incremental information, but they come with a greater degree of uncertainty. Such figures are most suitable for updating existing judgments rather than serving as a basis for making major investment decisions or policy conclusions on their own. Especially when the increase is only 0.1%, analysts should regard these figures as a signal of “near-stability” rather than strong expansion.
To determine whether this slight increase is sustainable, it is also necessary to look at the industry coverage in the next detailed report. If the growth is concentrated only in energy and a few aerospace deliveries, while other manufacturing industries are weakening, then a positive overall figure does not necessarily indicate a general improvement for companies; only if subsequent disclosures show a recovery in more industries will the conclusion be more solid. The regional dimension is also important: there are significant differences in the manufacturing structures of different provinces, and the overall figure may mask regional disparities. The current brief report does not provide enough data to support judgments about all sub-sectors, and therefore we should not infer non-existent industry rankings based on it.
How to make market judgments regarding revision risks
A common area that is prone to misuse in reporting is the confusion between “already published” and “already confirmed.” The statistical bureau releases preliminary figures, which is a factual event; however, corporate corrections, improvements to administrative data, and seasonal adjustments can still lead to changes in the results. A weighted response rate of 71.3% indicates that the sample observed this time is smaller than the final sample in regular monthly reports. For market participants, a more rigorous approach is to place the preliminary values, subsequent official values, and subsequent revisions in the same chronological list to observe the long-term deviations in this series, rather than remembering only one initial value, whether it is pleasing or not, for each month.
A 0.1% increase still needs to be compared with the usual fluctuations. Manufacturing sales involve large orders and deliveries across months, so changes in the timing of a few deliveries can affect the monthly figures. If a company ships products at the end of September or the invoice confirmation is extended into October, without a corresponding shift in economic activity on that scale, the monthly statistics may still change. Therefore, macro analysis usually focuses on trends over several consecutive months and industry distribution. A single month's direction can provide us with "initial evidence of no significant decline," but it is not sufficient to prove that capacity utilization, employment, and orders are all improving.
For the average reader, the most useful information is what follows next. On November 13th, the statistical bureau is expected to release the official estimates for September, which are based on more comprehensive surveys and administrative data. At that time, what will need to be compared is not only the overall growth rate, but also whether the drivers of energy and aerospace industries have continued to contribute, whether other sectors have kept up, and whether current price sales are consistent with actual output. If the official figures show a decline, today's preliminary indicators are not "fake news"; they were originally labeled as early estimates that would be revised.
There were no significant changes in Canadian manufacturing this time that would allow for easy conclusions to be drawn. A preliminary growth rate close to zero seems to be a reminder to the market to remain patient: it provides an initial observation for September, and also clearly states the limitations of the data, which are not yet complete, in the announcement itself. News reports clarify these limitations as well, so that the decimal point and its subsequent digits do not have to bear an excessive macroeconomic narrative that they cannot sustain.
Source: Statistics Canada, October 23, 2026 Monthly Survey of Manufacturing : Advance indicator, September 2026 https :// www150.statcan.gc.ca / n1 / daily-quotidien /261023/ dq261023b-eng.htm