















According to CoinMeta data, as of press time, Bitcoin is quoted at $83,032, up over the past 24 hours. Behind this number lies a major contradiction: ETFs saw a single-day inflow of $527 million, the largest in nearly a month, but Bitcoin quickly pulled back to $81,678 after touching $83,062 intraday, with selling pressure above $83,000 clearly visible. Moreover, almost all of this $527 million came from BlackRock's IBIT alone, while Fidelity and Grayscale were still seeing outflows during the same period. So, is Bitcoin setting a bull trap or staging a rebound?
Table: Overview of Bitcoin's Latest Key Data
| Metric | Latest Value |
|---|---|
| Bitcoin Price | ~$82,818, up 1.21% in 24 hours |
| Market Cap | ~$1.66 Trillion |
| 24-Hour Trading Volume | ~$25 Billion to $25.9 Billion |
| Market Dominance | 59.81% |
| Bitcoin Spot ETF Single-Day Net Inflow | $526.7 Million (October 20) |
| Fear & Greed Index | 64 (Greed) |
| Perpetual Contract Funding Rate | ~8.8% annualized, positive on most platforms |
| Open Interest | ~$27.4 Billion |
| Exchange Bitcoin Reserves | ~2.68 Million BTC |
| USDT Market Cap | ~$182.7 Billion to $183 Billion |
Note: The above content is compiled and summarized by CoinMeta based on public market data. Please refer to actual data if there are any fluctuations.
Bitcoin Price Action Analysis Today
Bitcoin Real-Time Market Analysis
According to CoinMeta's BTC/USDT 4-hour candlestick chart, BTC is currently quoted at $82,806, overall in a wide-ranging downward channel, revealing heavy overhead resistance. Our analysis suggests the candlesticks show a weak oscillation with "lower highs," with the $83,000-$84,000 range forming a strong short-term resistance band. As long as the daily chart cannot break above this area with volume, any upside can only be defined as a technical rebound within a downtrend.
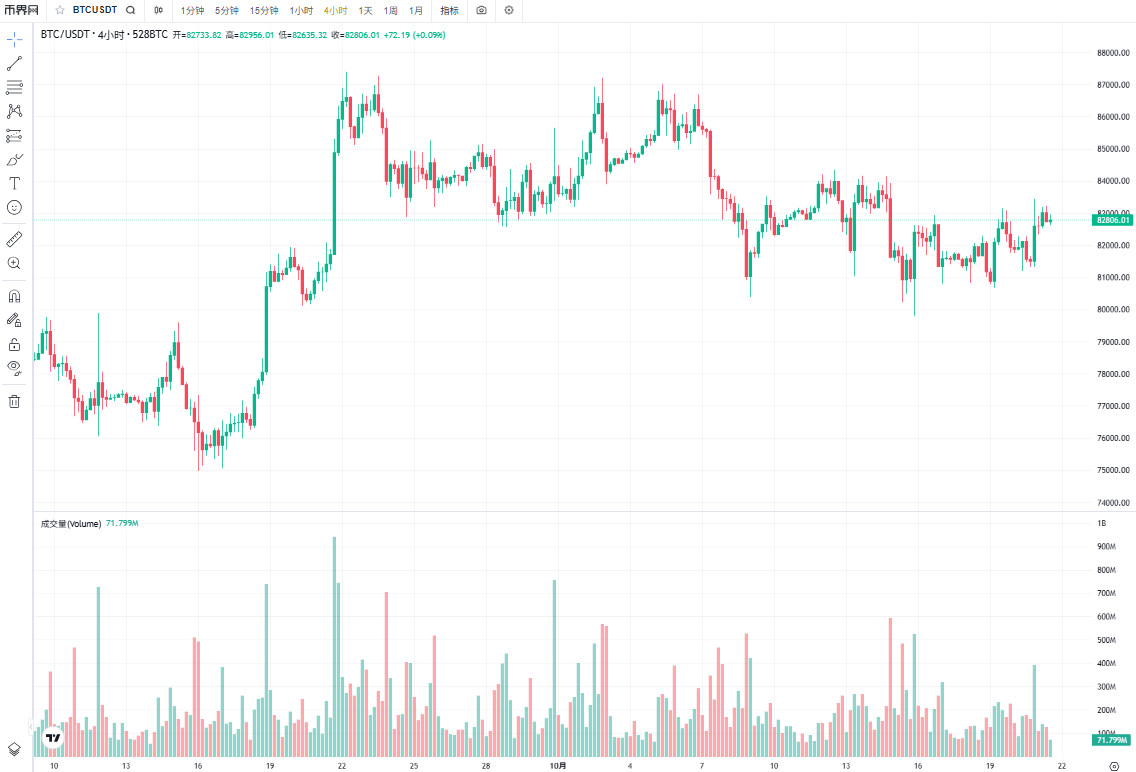
Image: Bitcoin Real-Time Candlestick Chart
Looking at trading volume, the volume bars at the bottom show that the recent rebound has been accompanied by shrinking volume. This "low-volume rebound" is often a typical feature of a bull trap, indicating weak willingness to chase the rally and that buying power has not materially returned. It can be inferred that the market is in a state of stock capital gaming, and once it touches the dense trapped-position area above, selling pressure is highly likely to be triggered.
Derivatives Market Analysis
Through CoinMeta's BTC total liquidation map, we can analyze the real driving force behind this price rally. The specific analysis is as follows:
24-hour data: Short liquidations reached $3.65 million, while long liquidations were only $1.09 million, with short liquidations more than 3 times that of longs.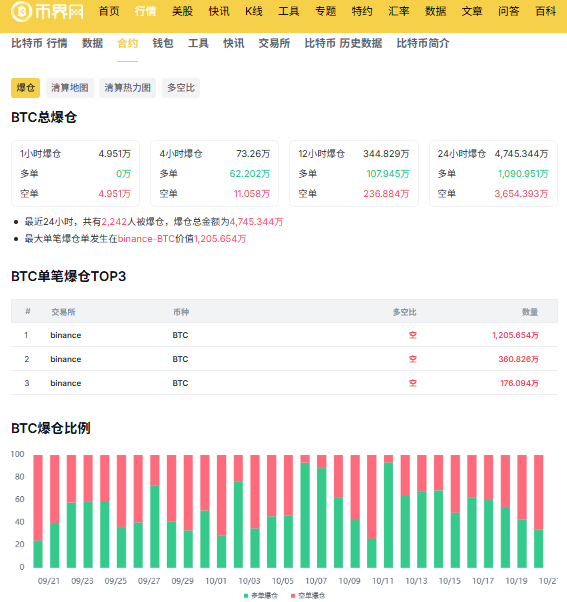
Image: Bitcoin Latest Liquidation Data
Top 3 single liquidations: All on Binance, and all were short positions, with the largest single liquidation reaching $1.2 million. This further confirms that this rally broke through a large number of short stop-loss levels, forcing shorts to buy to cover, which is a typical "short squeeze" market.
Our analysis leads to this conclusion: the current Bitcoin price increase did not originate from bulls actively buying on dips, but from the liquidation of short leverage. Once the "passive buying" from short covering is exhausted, if there is no real spot capital to follow through, the price can easily lose support again.
What Signal Does the $527 Million Single-Day ETF Inflow Send?
Although the headline figure of $526.7 million in Bitcoin ETF inflows is emotionally impactful, breaking down the product structure significantly changes the nature of the signal. Below is an overview of Bitcoin ETF flows over the last 5 days, in millions of USD:
| Date | Total Net Inflow/Outflow | IBIT (BlackRock) | FBTC (Fidelity) | GBTC (Grayscale) |
|---|---|---|---|---|
| October 15 | Net Outflow 142.5 | Net Outflow 35.2 | Net Outflow 48.1 | Net Outflow 42.6 |
| October 16 | Net Outflow 88.3 | Net Inflow 12.4 | Net Outflow 35.5 | Net Outflow 28.9 |
| October 17 | Net Outflow 82.4 | Net Outflow 15.1 | Net Outflow 32.8 | Net Outflow 21.5 |
| October 20 | Net Inflow 526.7 | Net Inflow 665.2 | Net Outflow 83.6 | Net Outflow 54.9 |
| October 21 | Net Inflow 23.2 | Net Inflow 29.9 | Net Inflow 3.6 | No significant flows |
IBIT Alone Outweighs the Entire Market, Other Top Products Still Outflowing
BlackRock's IBIT saw a single-day net inflow of $665.2 million, a figure higher than the combined net inflows of all spot Bitcoin ETFs. Meanwhile, Fidelity's FBTC saw a net outflow of $83.6 million, and Grayscale's GBTC saw a net outflow of $54.9 million. In other words, the so-called "ETF inflow" is not a comprehensive return of institutional capital to Bitcoin, but a concentrated rotation of capital within ETF products from high-fee products to the low-fee leader. Without this single BlackRock channel, the ETF capital situation on October 20 would actually have been a net outflow.
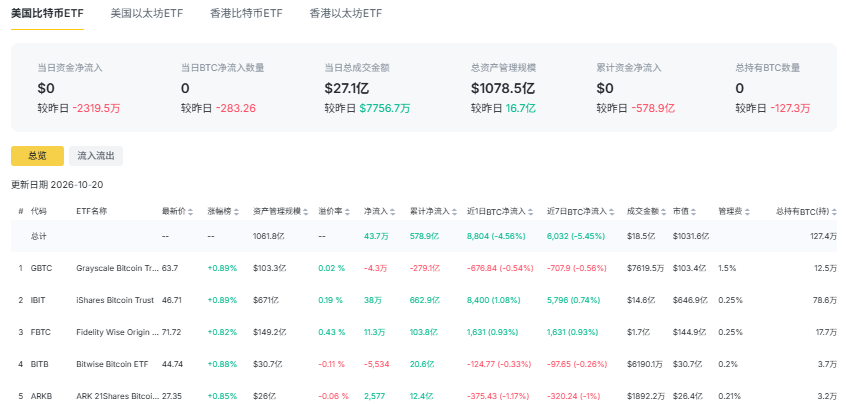
Image: Bitcoin ETF Overview
$527 Million Is Only a Partial Cover of $615 Million in Cumulative Outflows
Extending the time horizon, we can see:
Since October, spot Bitcoin ETFs have still recorded cumulative net outflows of about $88 million. The previous week saw $229 million in net outflows, and the week before that $681 million. On October 7, there was even a single-day outflow of $483.9 million, the largest since June. The $527 million single-day inflow, placed in this outflow sequence, is a rapid "cover" rather than a trend reversal. Equating concentrated single-day inflows with a capital flow reversal is incomplete in the chain of evidence.Rebound or Bull Trap?
Is Bitcoin's move a rebound or a bull trap? Let's state our conclusion first: a bull trap. Combined with the earlier analysis, the $527 million single-day ETF inflow is more likely to point to a "bull trap" rather than a trend reversal.
Coinbase Premium Negative for 20 Consecutive Days; ETF Inflows Not Transmitted to On-Chain Buying Pressure
The Coinbase Premium Index measures real buying strength in the US spot market. As of October 13, the index had remained negative for 20 consecutive days, at -0.1398%, a recent low, clearly indicating continued weakness in US market purchasing power. Since October, the index has further dropped from -0.012 to -0.123 (as of October 19), with the negative range continuing to expand.
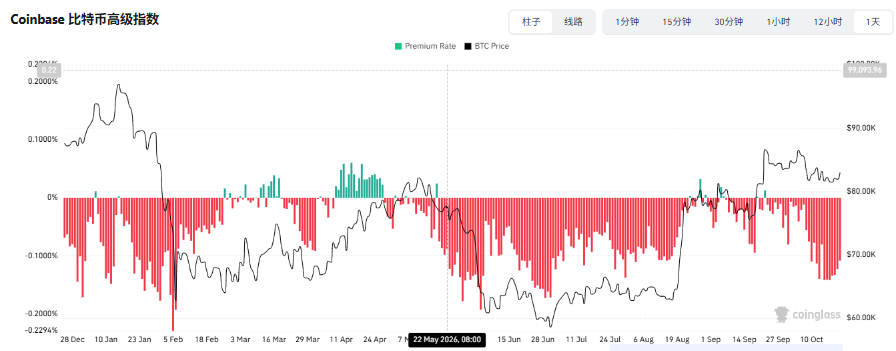
Image: Coinbase Premium Index
ETFs are "buying" at the fund level, while the spot market is "selling" at the coin-denominated level. The directional gap between the two means the $527 million inflow has not yet translated into real on-chain buying pressure. In our view, this is the most direct link in the "bull trap" judgment.
Liquidity Contraction: USDT Shrinks Nearly $1 Billion in Five Days
Incremental buying requires stablecoin liquidity as fuel, and that fuel is decreasing. We noted that in mid-October 2026, USDT's market cap decreased by nearly $1 billion within five days, with total supply dropping to approximately $183 billion on October 20. From early July to October 1, USDT balances across 19 major exchanges and lending platforms fell by a combined $4.6 billion, while inflows of USDC and RLUSD of about $1.9 billion over the same period could only partially offset, not fully replace, this decline. We can infer that this further lowers the probability of the rebound turning into a reversal.
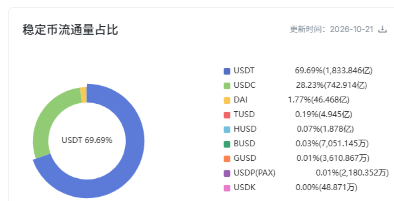
Image: Stablecoin Circulating Supply
Our View
Through the above analysis, the $527 million single-day ETF inflow for Bitcoin has no support in either dimension for a conclusion of "systemic capital flow reversal." Therefore, a more reasonable characterization of this inflow is a structural repair driven by sentiment positives combined with a short squeeze, rather than a confirmation signal of a trend reversal; the probability of a "bull trap" is significantly higher than that of a sustainable rebound.
Bitcoin Price Trend FAQ
Q: Will Bitcoin rise just because of the $527 million ETF inflow?
A: Not necessarily; a single-day inflow is insufficient to confirm an uptrend. Almost all of this $527 million came from IBIT alone, with capital concentrated in one product, which indicates channel preference, not a comprehensive return of institutions.
Q: Is it risky to chase the Bitcoin rally now?
A: The risk is relatively high because long positions have not been fully cleared out. Funding rates remain elevated, and options skew continues to tilt toward puts, meaning leveraged longs have not been fully washed out and demand for downside protection is still increasing.

Q: Will Bitcoin fall below $80,000 before the FOMC meeting?
A: The probability exists, but a break below is more likely to be a fakeout. The $80,000 level has served as effective support multiple times over the past month. HTX analysts believe that if a dip occurs, we judge it is most likely a false breakout rather than a trend-based breakdown.
Conclusion
Bitcoin's price today is approximately $83,000, with a single-day ETF inflow of $527 million. Is this a rebound or a bull trap? A more accurate characterization is: a structural repair driven by concentrated inflows into a single product, lacking on-chain spot coordination, occurring against the backdrop of derivatives not yet having cleared out. It has the appearance of a rebound, but does not possess the necessary conditions for a reversal.
Disclaimer: Readers are strictly advised to comply with local laws and regulations. This article is compiled based on public market data for reference and educational purposes only, and does not constitute investment advice. Follow CoinMeta for the latest updates.