

Key Points
- After producer inflation in the United States exceeded expectations, Ethereum briefly fell to $2,340 before rebounding above $2,400.
- In September, PPI increased by 6.3% year-on-year, and the core PPI increased by 5% year-on-year, both exceeding expectations.
- The support level is around $2,355, while the resistance level ranges from $2,496 to $2,552, which may limit any rebound.
Ethereum rebounds after producer inflation unexpectedly heats up
On Friday, Ethereum returned above $2,400 after the U.S. wholesale inflation report was stronger than expected. Previously, this cryptocurrency had been pushed down to around $2,340.
The U.S. Producer Price Index ( PPI ) in September rose 1.3% month-on-month and 6.3% year-on-year, both exceeding market expectations of 0.5% and 5.3% respectively.
Excluding the core PPI of food and energy prices, which also rose higher than expected, with a month-on-month increase of 0.7% and a year-on-year increase of 5%, while market expectations were 0.3% and 4.4% respectively.
These data were released following the consumer price index ( CPI ) on Wednesday, which also exceeded expectations, exacerbating market concerns regarding ongoing inflation and the prospects for monetary policy.
Before the rebound, Ethereum, along with other risky assets, fell first, and then recovered as the yield on U.S. Treasury bonds and the value of the dollar declined.
The concentration of losses among bullish traders highlights the pressure borne by leveraged positions during the downward trend. Forced liquidations will further exacerbate the selling pressure as prices fall and erode traders' collateral.
The data covered in the text represents a complete 24-hour period, including fluctuations before and after the release of inflation data, and not just the immediate reaction after the release of the data on Thursday PPI.
Ethereum's rebound came alongside a decline in the yield of 10-year U.S. Treasury bonds to 5.095%, the lowest level since September 22.
Lower yields have helped to alleviate some of the pressure on Ethereum that was previously caused by inflation-driven expectations of rising borrowing costs.
As of press time, the US Dollar Index has also retraced some of the gains posted after the release of CPI, falling back to around 102.04.
The decline in yields and the weakening of the US dollar have jointly provided a more favorable backdrop for a broader rebound in cryptocurrencies, although concerns about inflation remain unresolved.
Ethereum holds above the $2,355 support level, but still faces resistance
From the daily chart, Ethereum rebounded from a brief drop below the 100-day exponential moving average of $2,356 and the support level of $2,355.
Bids are currently attempting to maintain a rebound above $2,411. Momentum indicators show some improvement.
Relative Strength Index (RSI) RSI has risen to 40.9, while the stochastic indicator is close to 25. Both indicators suggest that the current bearish pressure has eased, but a trend reversal has not yet been confirmed.
The first resistance level on the upside is $2,496, which corresponds to the 50-day EMA. Above that, the level of $2,548 and $2,552, which represents the 20-day EMA, form a contiguous resistance zone.
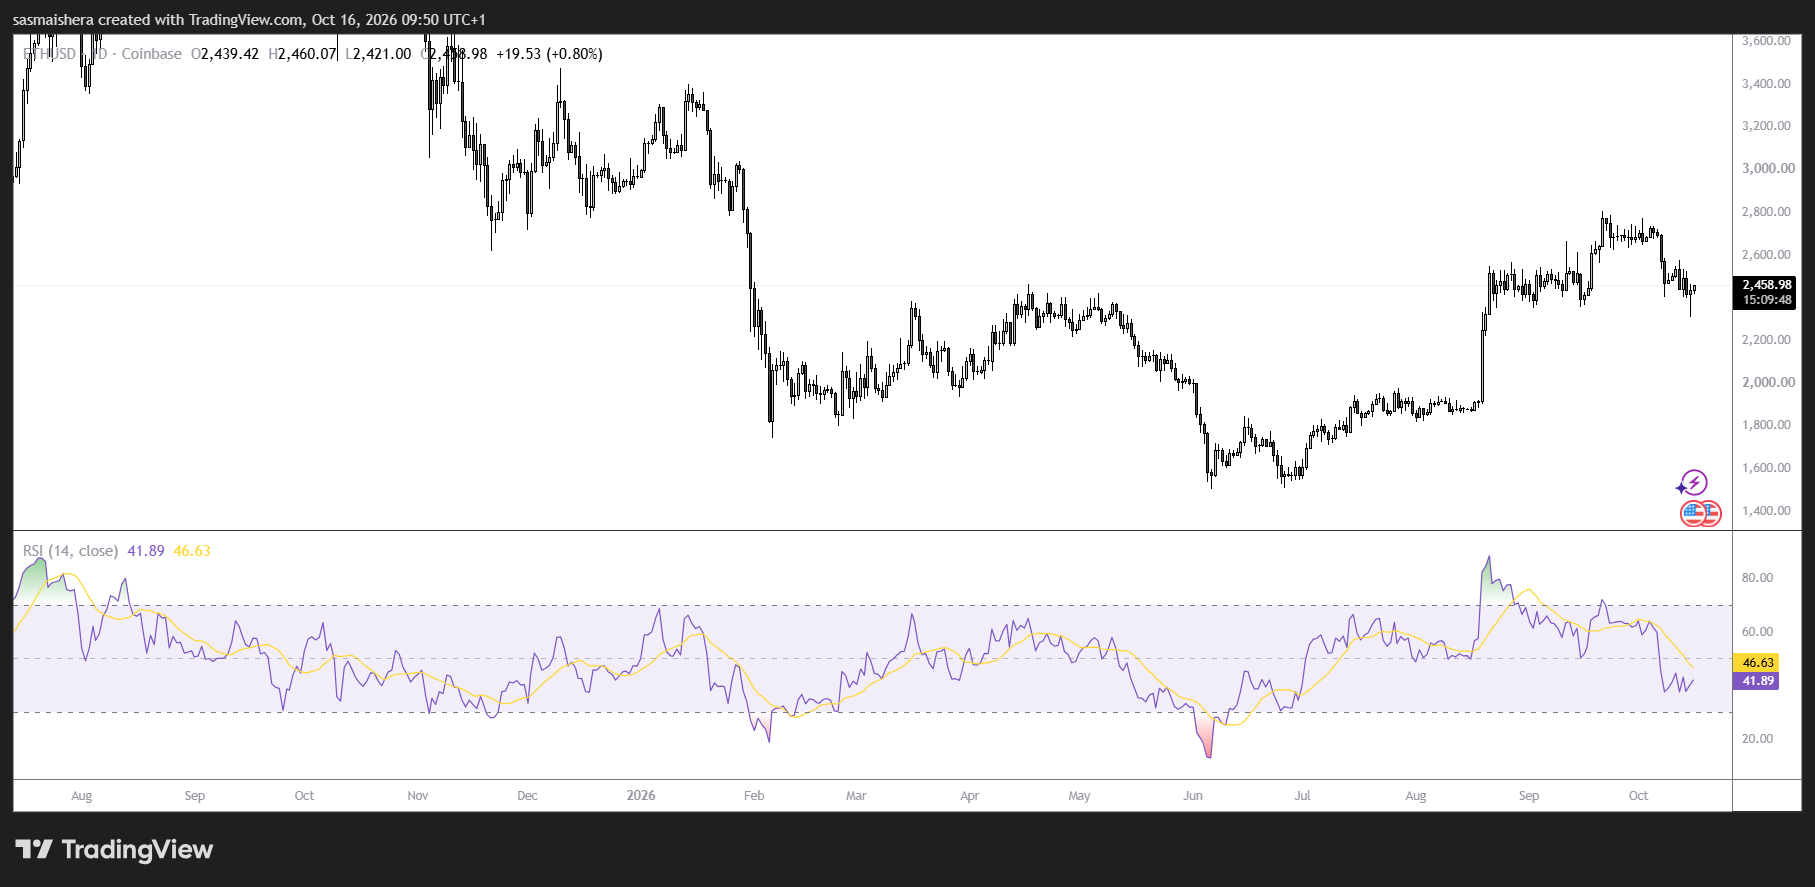
If it is possible to regain these levels, it will enhance the prospects for a short-term rebound. On the downside, the range between $2,355 and $2,356 remains important. If the daily close falls below this range, there could be a decline to the support level of $2,204, followed by $1,971 and then $1,827.