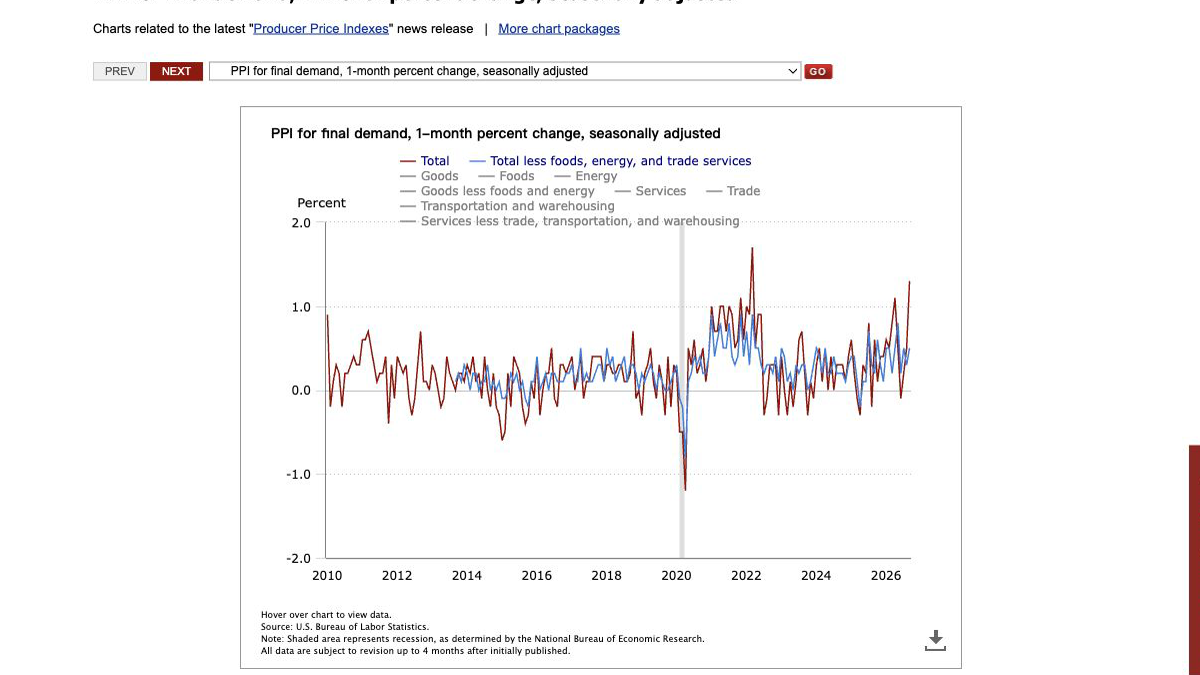
The consumer price data released by the United States the previous day already indicated energy pressures, and the Producer Price Index (PPI) released on October 15 revealed an even more severe situation on the supply side. According to the U.S. Bureau of Labor Statistics, final demand in September PPI rose 1.3% month-on-month after seasonal adjustment, marking the largest single-month increase since March 2022; the year-on-year increase (unadjusted for seasonality) was 6.3%. Commodity prices rose by 2.6%, and service prices rose by 0.8%. A month's worth of data cannot definitively conclude a new round of persistent inflation, but it also cannot be assumed that all these pressures will disappear just after a vehicle refuels.
The contribution of oil prices is indeed prominent. BLS states that over 80% of the increase in the prices of final-demand goods this month comes from a 10.8% rise in the energy index; looking at gasoline alone, its price increased by 20.3%, which accounts for about half of the overall increase in commodity prices. When readers see the PPI figure, they should first remember that it does not represent the prices in residents' shopping baskets. PPI measures the selling prices received by domestic producers, while the Consumer Price Index measures the prices paid by buyers. Taxes, channel profits, imported goods, and different statistical weights can all lead to different outcomes between the two. Yesterday's CPI and today's PPI provide clues for each other, but they cannot be added together or considered the same inflation rate.
Beyond the energy shock, why is it worth taking a closer look at service prices?
If only the prices of gasoline and diesel increase, the analysis can focus more on the temporary factors related to international crude oil, refining, and transportation. However, BLS also reported a 0.8% increase in service prices, and the final demand trade service profit margin index rose by 1.4%, contributing nearly half of the increase in service prices. The "trade services" mentioned here do not refer to the product pricing on online shopping platforms, but rather the profit margins formed by the difference between the purchase and sale prices for wholesalers and retailers. The wholesale profit margin for machinery and vehicles increased by 3.9%, which significantly drove up service prices. To imply that all service companies raised their prices by 3.9% would be a misinterpretation of the original data.
Transport and warehousing services saw a price increase of 3.4%, and the report also listed upward trends in areas such as truck freight, accommodation, wholesale of food and alcoholic beverages, and air passenger transport. When facing changes in energy and logistics costs, businesses may adjust their transportation pricing, or they may temporarily compress their profits and wait for renegotiations of contracts. As a result, the high readings in PPI may be transmitted to consumers at different speeds: some goods quickly become more expensive, some are buffered by inventory and fixed contracts, and some are not fully passed on in the end. To observe this "transmission" effect, it is necessary to look at subsequent months, rather than assuming that the CPI in October will necessarily see the same percentage increase as in September.
The report also provides a final demand indicator that excludes food, energy, and trade services, which rose by 0.5% month-on-month in September, higher than the 0.3% increase in August, and by 5.0% year-on-year. The significance of this measure is to minimize the impact of the more volatile profit margins in energy and trade, allowing for a broader observation of price changes; it is not “more accurate” than the overall index; rather, it answers a different question. The overall index tells businesses what prices have changed this month, while the excluded items help to determine whether pressures are spreading. Looking at both sets of data together is more prudent than focusing only on the most alarming 1.3% figure or emphasizing the contribution of energy alone.
Will rising prices upstream turn into the next shopping receipt?
There is no fixed pipeline for the transfer of producer prices to consumer prices. In some industrial chains, there are contracts spanning several months between raw materials, transportation, and retail; in other services, the selling prices vary with demand and competition and may not be synchronized with costs. If a company already has inventory, an increase in spot energy prices may only affect new batches; if demand weakens, companies may not be able to pass on the increased costs. Conversely, when there are changes in profit margins across energy, logistics, and trade, the price increases felt by consumers can be more sustained than those resulting from changes in a single raw material. The September report provided clues to the risks, but it has not yet provided a definitive answer.
A year-on-year increase of 6.3% represents the cumulative change over the past twelve months, while a month-on-month increase of 1.3% refers to the change in September compared to August; neither can replace the other. A significant rise in one month can boost the year-on-year figure, but the year-on-year rate is also affected by the base level from the same period last year. BLS also indicates that some historical data for previous months may be revised due to delayed reporting or corrections. Therefore, it is more worthwhile to track the changes and revision trends over several consecutive months. When assessing policies, the market takes into account employment, wages, and consumer inflation, rather than letting PPI determine the interest rate path alone.
For businesses, more concrete issues than "price indices reaching multi-year highs" include whether contracts allow for price adjustments, how long inventories can sustain them, and whether transportation costs will continue to rise. For households, it is necessary to observe whether the increase in gasoline prices will subside, as well as whether food prices, rent, and daily services will follow suit. For investors, it is not advisable to simply assume that profits of certain types of businesses will increase based on PPI. An increase in selling prices may be accompanied by an increase in input costs, and trade profit margins are not the same as operating profits. Different industries are located at different points in the price chain.
There is another easily overlooked time difference: producer prices are based on transactions and quotes for specific months, while corporate financial reports present changes in revenue, costs, and inventory for an entire quarter. Even if the cost of a certain input increases rapidly in September, it does not mean that every company purchased at the new price during that quarter, nor does it imply that all companies have the ability to immediately pass on the increased costs to their customers. When studying the impact on the industry, it is best to consider factors such as the duration of company contracts, the proportion of energy consumption, and inventory turnover, rather than applying a single national index to draw the same conclusions for each company.
The hard facts for September PPI are that the final demand increased by 1.3% month-on-month and 6.3% year-on-year. Energy has driven the commodity side, and there has also been a visible upward trend on the service side. What needs to be verified in the next report is whether the impact of energy will weaken, whether prices excluding volatile items will continue to rise, and whether the September figures will be revised. Keeping these questions open is more useful than immediately announcing a "full-scale price increase" for all industries.