

Key Points
- After inflation in the United States exceeded expectations and disrupted the crypto market, Ethereum fell below $2,400, losing 5.3% within 24 hours.
- Rising U.S. Treasury yields, a stronger dollar, and increasing expectations of interest rate hikes are further putting pressure on ETH.
- The key support levels are around $2,353 to $2,355, while resistance levels near $2,498 and $2,548 may hinder a rebound.
Inflationary pressures have sparked concerns about interest rate hikes, causing Ethereum to decline.
On Thursday, as stronger-than-expected U.S. inflation data triggered another round of selling in the cryptocurrency market, Ethereum continued its downward trend, falling below $2,400.
At the time of reporting, this second-largest cryptocurrency by market value was hovering around $2,370, with a decline of about 5.3% in the past 24 hours.
In September, the Consumer Price Index ( CPI ) rose by 0.6% month-on-month, in line with expectations, but the increase was faster than the 0.4% growth rate in August. The annual overall inflation rate climbed to 3.7%, higher than the forecast of 3.6% and also above the previous level of 3.4%.
Core inflation, excluding food and energy prices, also exceeded expectations. The indicator rose by 0.3% month-on-month and by 2.6% year-on-year, both higher than the forecasts of 0.2% and 2.5% respectively.
These data have exacerbated market concerns that persistent inflation may lead to further tightening of monetary policy, and have weakened demand for risk assets.
After the inflation data was released, U.S. Treasury yields and the dollar strengthened, putting additional pressure on Ethereum.
The yield on 10-year U.S. Treasury bonds once rose to 5.32%, before falling back to around 5.22%. Meanwhile, it is reported that the U.S. Dollar Index has risen above 102.80 for the first time since April 2025.
Higher U.S. Treasury yields have increased the relative attractiveness of interest-bearing assets and also raised the opportunity cost of holding cryptocurrencies. A stronger dollar may also suppress the prices of crypto assets denominated in dollars.
Meanwhile, data from CME FedWatch shows that the probability of the Federal Reserve raising interest rates at its October meeting has risen from 22% to 35%.
This repricing has reinforced market expectations of further tightening of financial conditions, making Ethereum more susceptible to further selling pressure.
ETH Long positions account for the majority of liquidations
The decline in Ethereum also forced traders using leverage to close their positions. CoinGlass data shows that in the past 24 hours, the ETH settlement amount reached 293.98 million US dollars.
90% of it came from long positions, indicating that traders who bet on price increases bore most of the losses.
Multiple consecutive rounds of long liquidations have highlighted the pressure faced by bullish leveraged positions. A decline in price will trigger more positions to be closed, thereby exacerbating the selling pressure.
On-chain data shows that potential selling pressure is also accumulating outside of the derivatives market.
CryptoQuant data shows that since Sunday, the net inflow into Ethereum exchanges has been positive, continuing the similar pattern from last week.
A positive net inflow means that the amount of ETH flowing into the exchange is more than the amount of ETH flowing out. Such trends may indicate that holders are preparing to sell, but merely recharging does not confirm that a sale has actually taken place.
Combined with the continuously rising long liquidations, this trend means that Ethereum is facing pressure from both leveraged positions and potential spot supply.
Ethereum encounters resistance below $2,563
The Ethereum daily chart maintains a short-term bearish pattern, with the price below the 50-day exponential moving average of $2,498 and also below the 20-day exponential moving average of $2,563.
The first resistance level for a rebound is the 50-day moving average. Above that, the resistance level at $2,548, together with the 20-day moving average, forms an additional obstacle that limits further upward movement.
If a breakthrough can be achieved in this area, the market will focus on $2,636, followed by resistance around $2,781.
The momentum remains weak. On the 14th, the Relative Strength Index was around 38, and the Stochastic Oscillator was close to 7, indicating an oversold condition. These readings may support a brief stabilization or a short-term rebound, but they do not confirm that the downward trend has reversed.
The original analysis considers the recent closing price of $2,432 as an immediate reference point, however, the Ethereum quote is around $2,430, which is slightly below that level.
In the following aspect, the level of $2,355 provides strong support, which is very close to the height of the 100-day moving average at $2,353, forming an important support area.
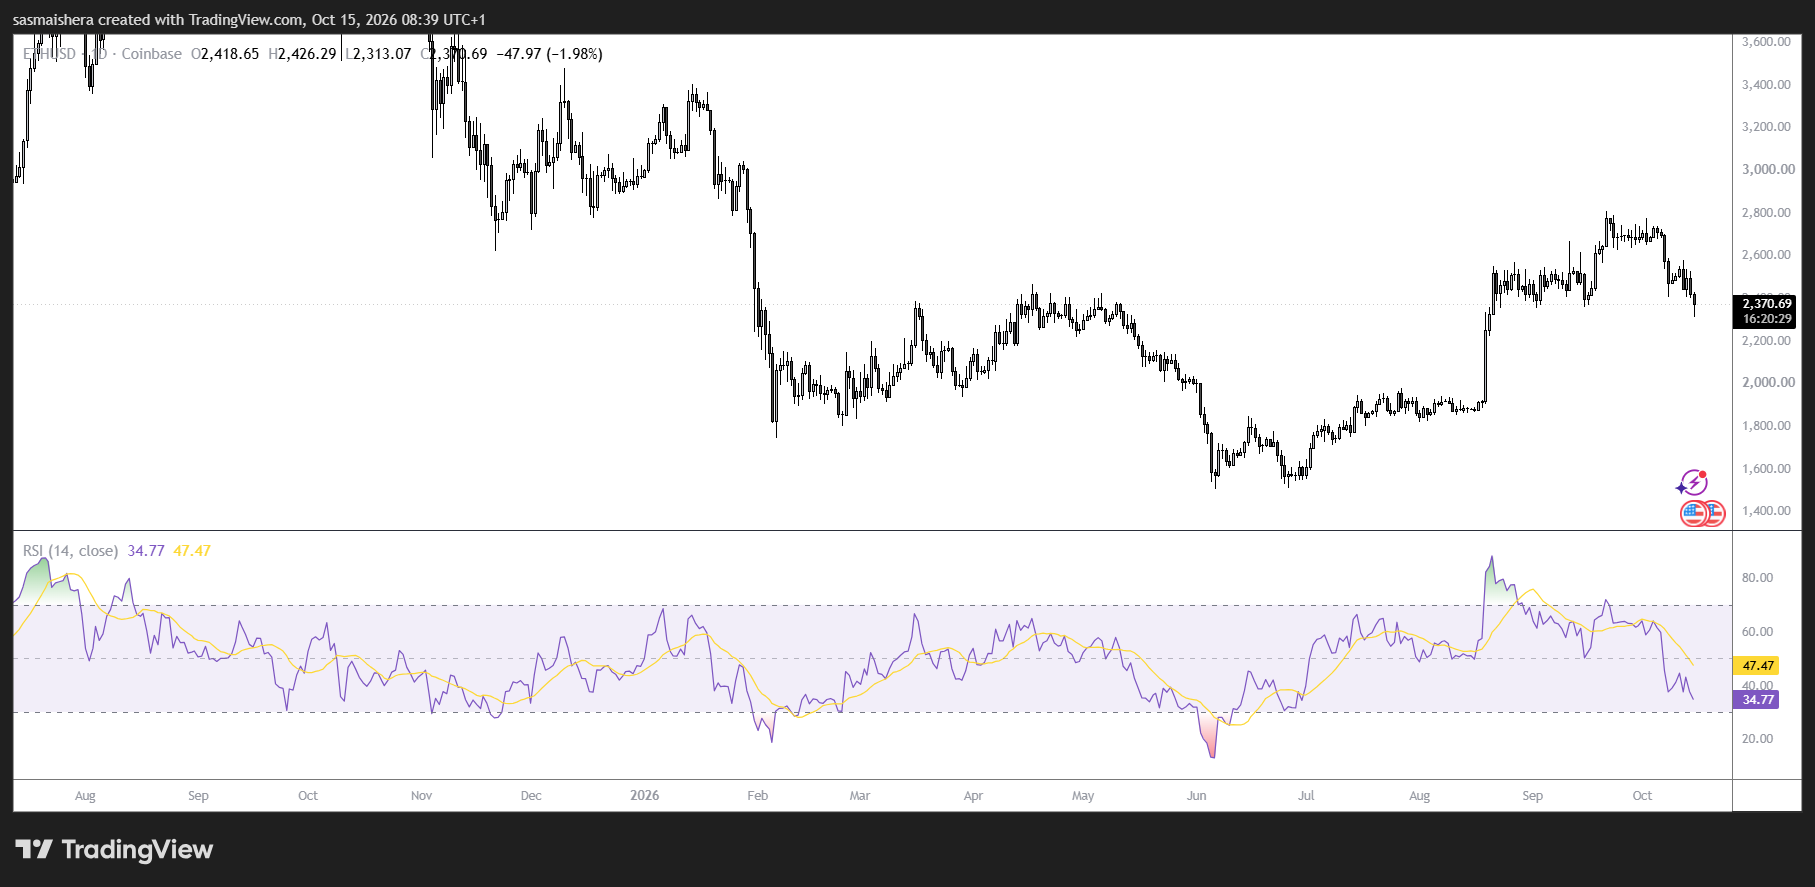
Holding this area will reserve a certain buffer for the medium to long-term trend, although the short-term outlook remains weak. If it effectively breaks below this region, the next step could be a decline to $2204 and $1971.
Currently, the outlook for Ethereum's rebound depends on whether the buying pressure can stabilize prices and regain the upper resistance levels amidst ongoing concerns about inflation and selling pressure.