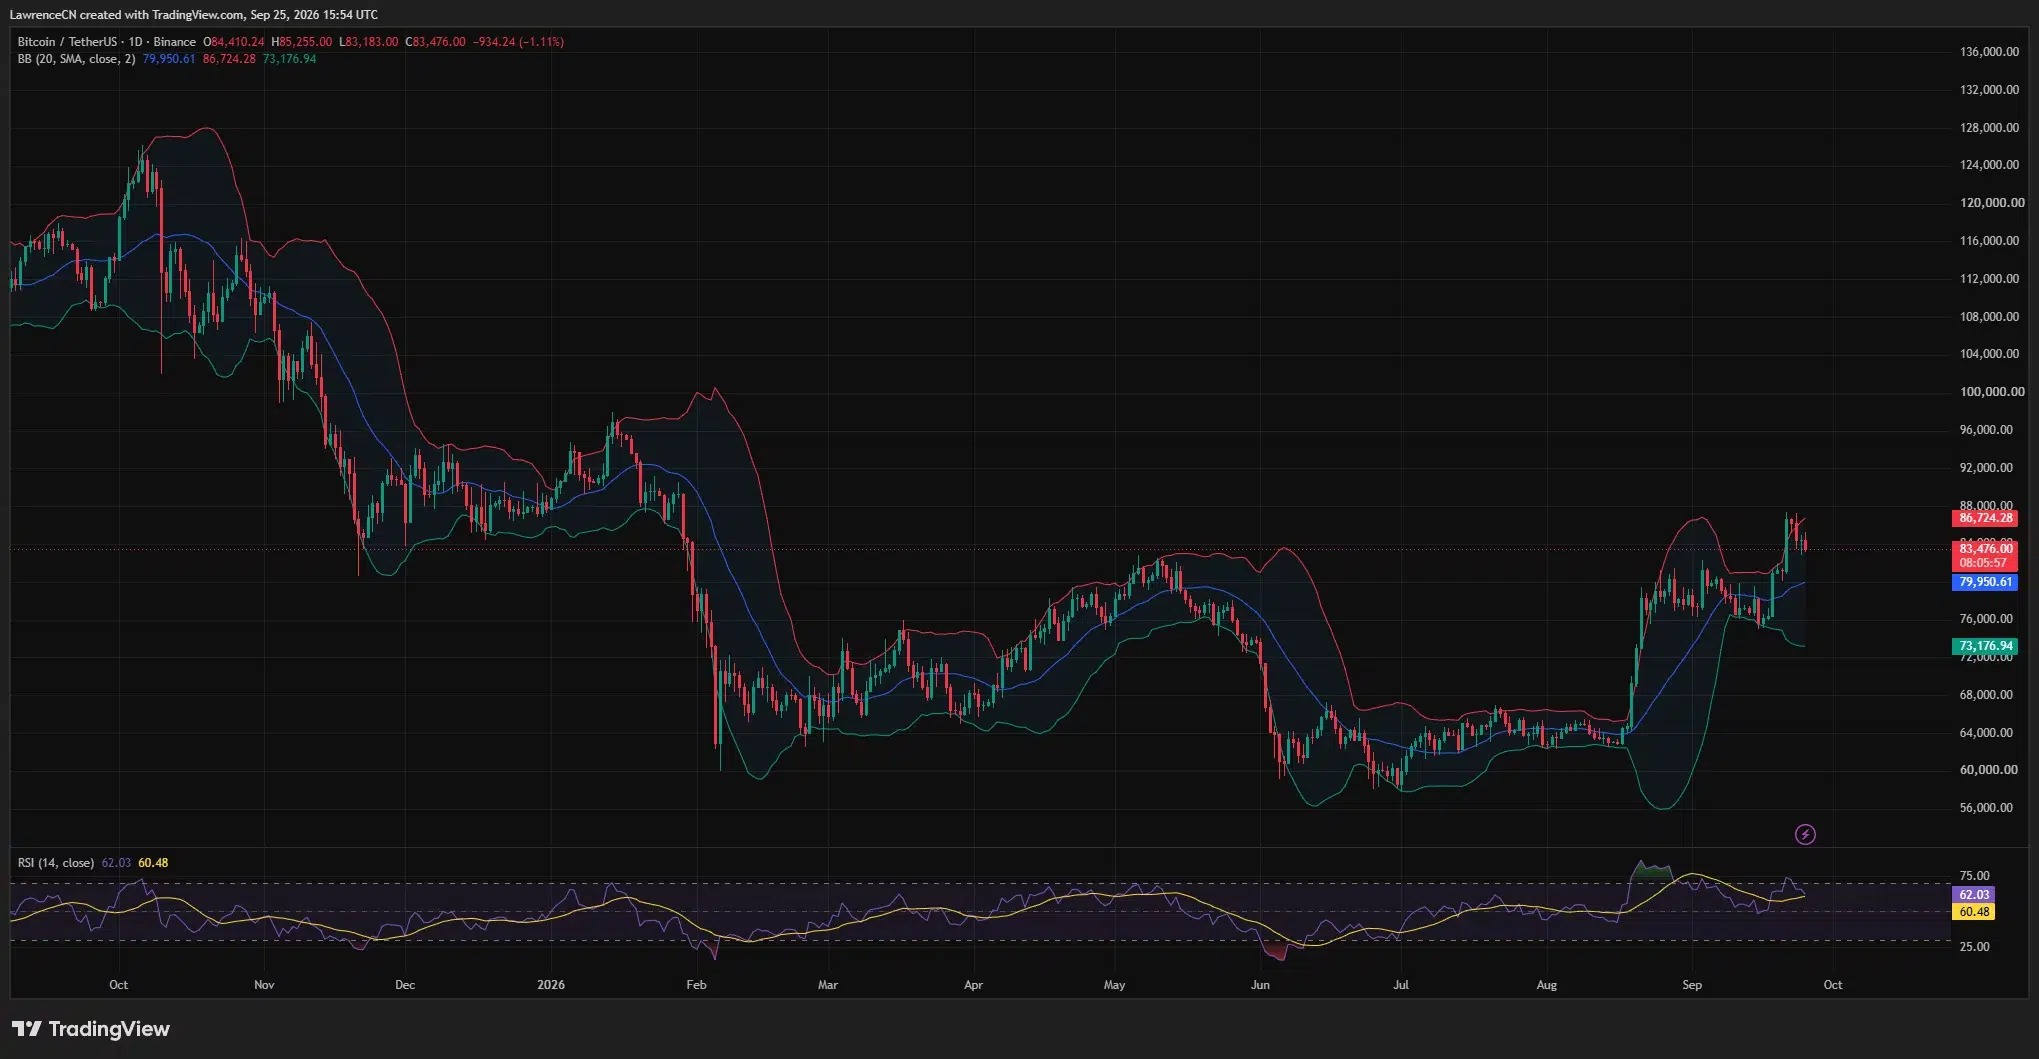


After testing 80,400 US dollars, the price of Bitcoin rebounded to around 83,000 US dollars. However, the daily momentum is weakening, while the weekly breakout remains positive. Therefore, its outlook for October depends on whether it can hold the support range between 79,600 and 80,400 US dollars.
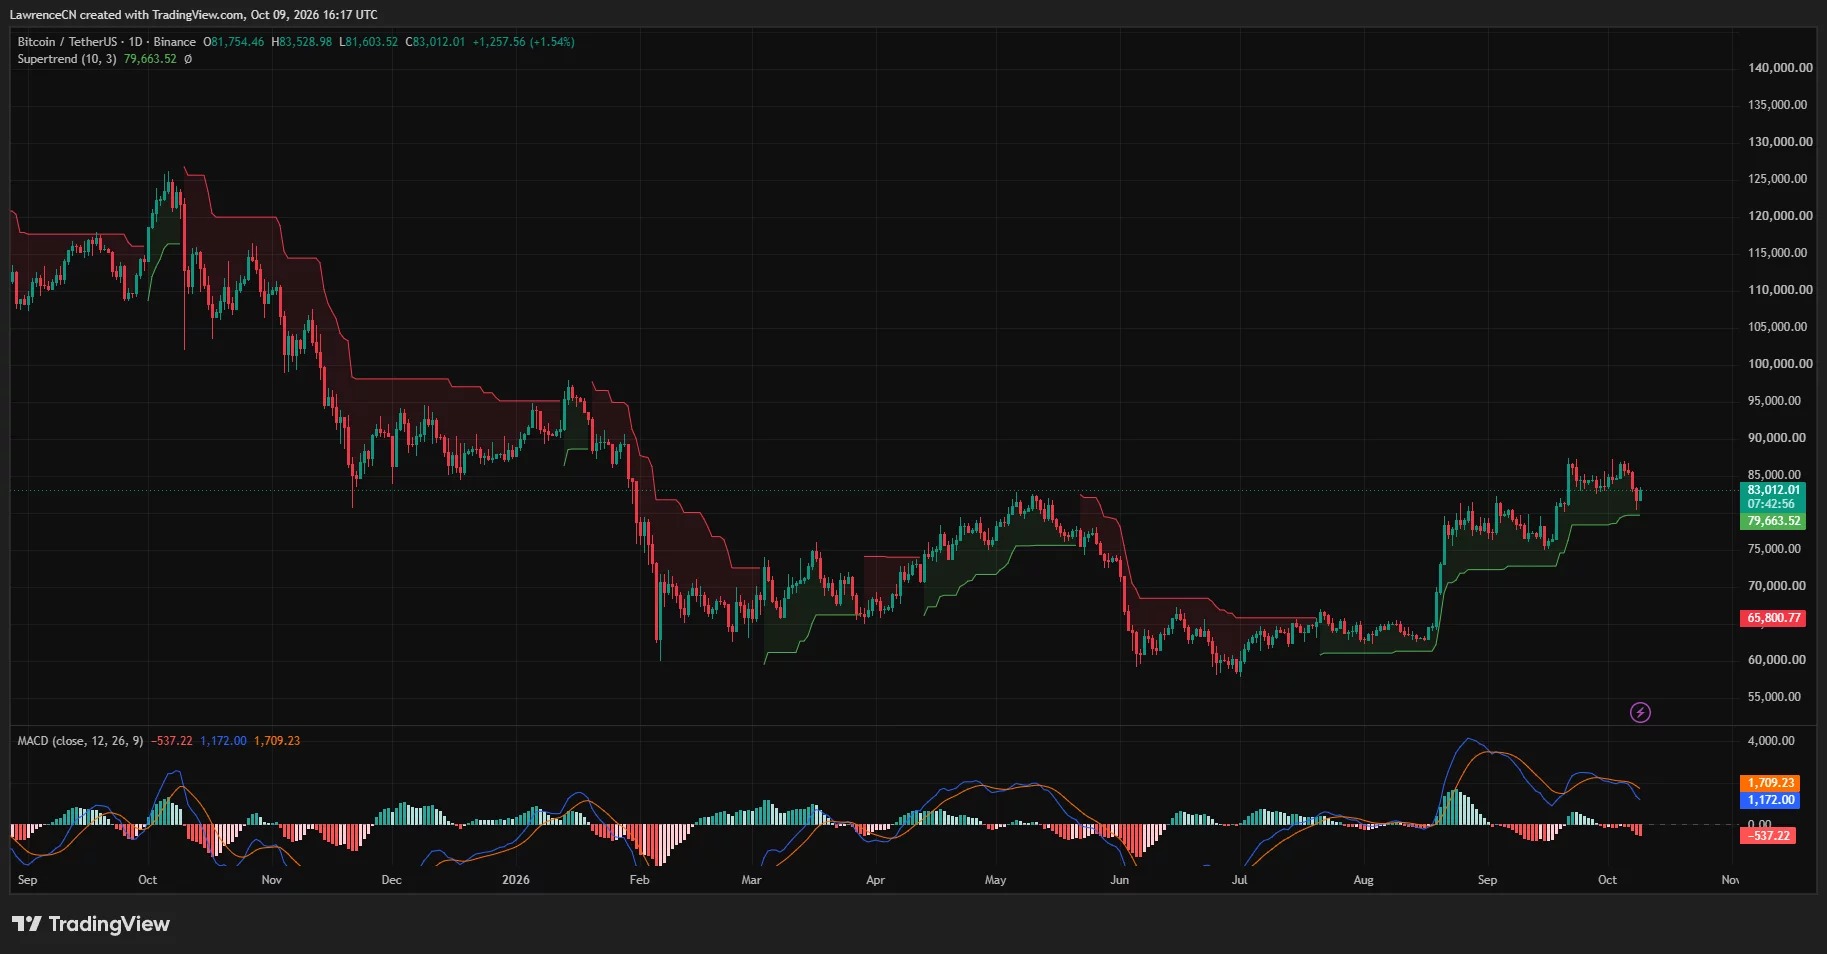
$79,663 is the daily support level Supertrend below which Bitcoin has rebounded to around $83,000.
The daily chart MACD remains bearish, with the bar chart dropping to around -537.
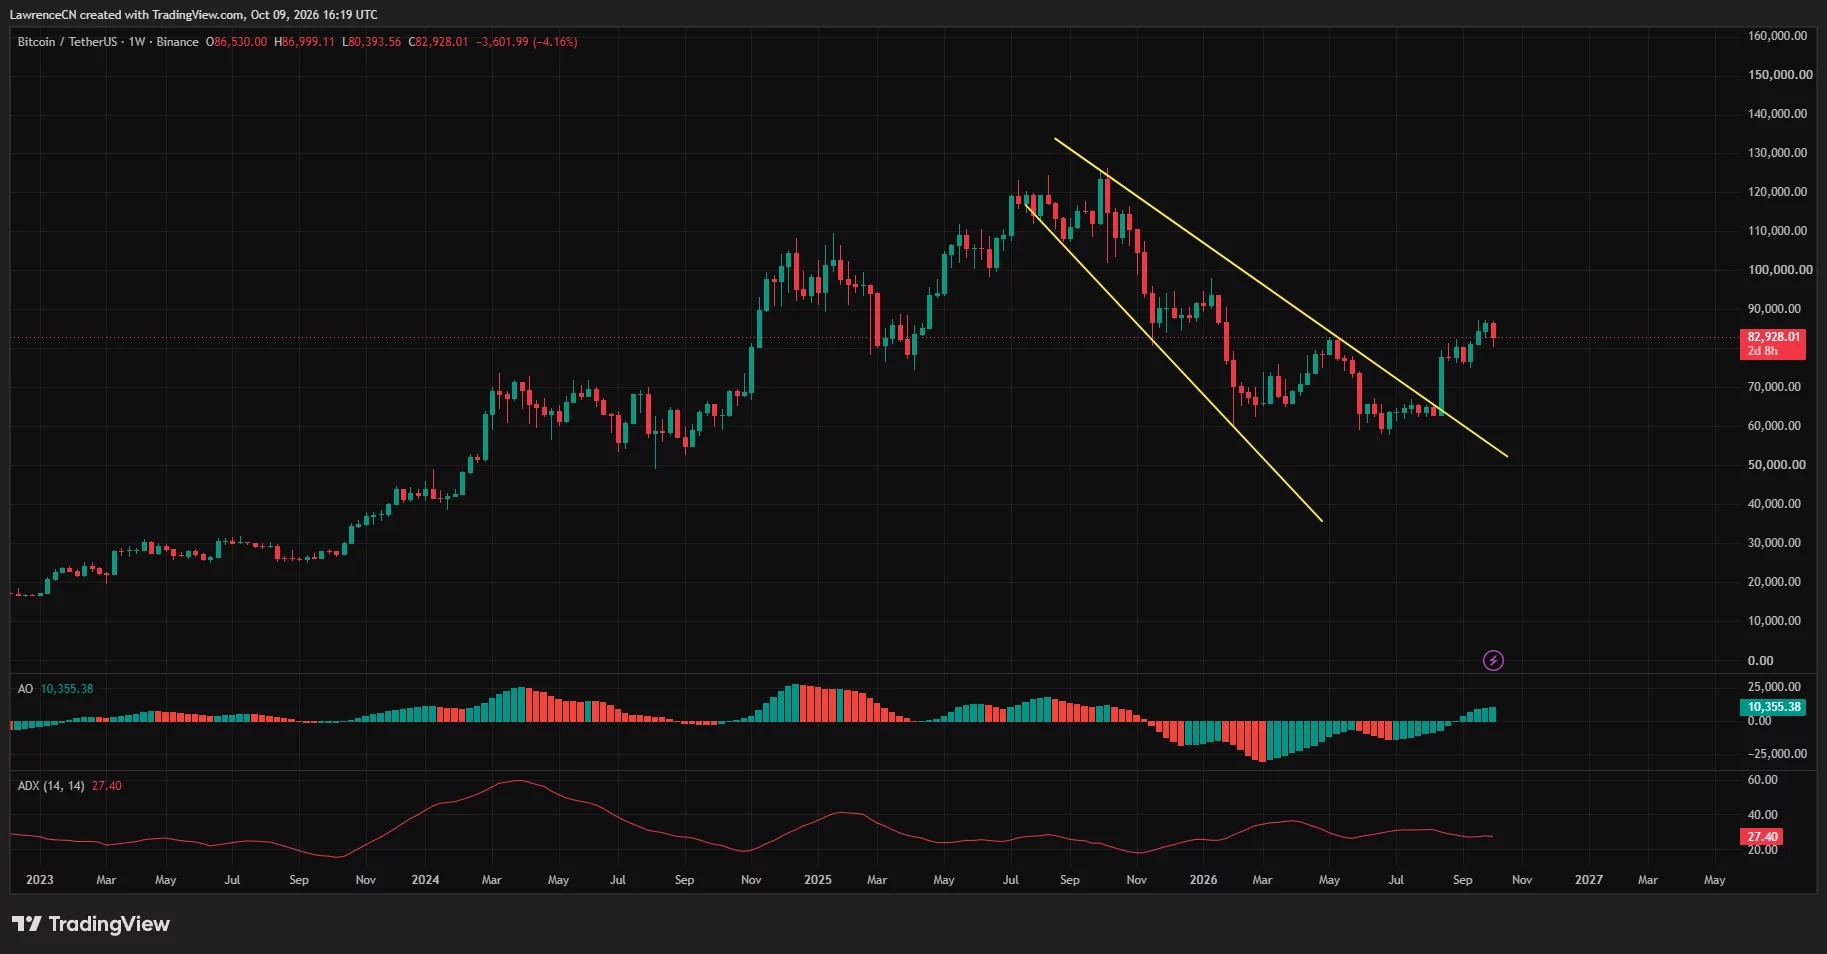
The Bitcoin weekly chart is still above the upper edge of the descending wedge pattern.
The liquidation heat map shows that a large number of leveraged positions are concentrated around $87,000.
The Binance BTC / USDT daily chart shows that Bitcoin was at $83,012 on October 9th, while the weekly chart indicates it was at $82,928. The weekly price fell by 4.16% that week, with a previous high of $86,999 and a low of $80,394.
Therefore, the rebound of Bitcoin has narrowed the distance between it and its recent high points, but it has not reversed the downward trend of the weekly chart. The charts provide conflicting signals for the remainder of October: short-term momentum has deteriorated, while the broader rebound that began from the summer lows is still intact.
Bitcoin's support at $80,000 faces its next test
On the TradingView daily chart, Bitcoin is still above the green Supertrend line at $79,663.52. This indicator still supports a bullish trend, but recent declines have brought the price closer to this threshold.
The reading, combined with the weekly low, indicates that the main support range is around $79,600 to $80,400. If it continues to fall below this range, it will weaken the daily rebound structure and expose the market to the trading area near $75,000 to $76,000 from before.
The daily chart MACD provides a more cautious signal. Its blue line indicates 1,172, which is below the orange signal line of 1,709.23, and the bar chart shows a value of -537.22.
This bearish crossover indicates that despite the rebound in Bitcoin, the upward momentum has slowed down. However, both of the MACD lines are still above the zero axis, which means that the current situation is one of weakening momentum, rather than a complete shift to negative indicators.
Based on these chart signals, unless Bitcoin accumulates momentum again above the nearby resistance zones, it is still possible to test support levels once more. A rebound to $84,000 to $85,000 would represent a preliminary improvement; however, the recent high of $86,500 to $87,000 represents a more significant resistance level.
The weekly breakout still makes the rebound scenario valid.
The Bitcoin weekly chart TradingView shows that the price is still above the upper boundary of a descending wedge drawn during the decline from the high point in 2025. The breakout occurred before the recent pullback, and the recent candlesticks are still above this descending boundary.
Therefore, the weekly chart structure still supports a conditional rebound scenario. The pullback has not yet brought Bitcoin back within the wedge pattern; however, merely maintaining it above that formation does not confirm a new upward trend.
The weekly chart Awesome Oscillator shows a reading of 10,355.38, with the green bars located above the zero axis. This reading contrasts with the bearish signal on the daily chart MACD, indicating that the momentum over a longer time period is still stronger.
The weekly chart ADX shows a value of 27.40. This reading indicates that a trend has formed, but ADX measures strength rather than direction, so it cannot alone confirm that Bitcoin will definitely rise.
Overall, the weekly breakout and positive oscillation indicators leave room for another attempt to reach $87,000, provided that the nearby support levels remain intact. If this recent high can be continuously broken through, it will strengthen the basis for a push towards $90,000 on a chart-level perspective.
If Bitcoin repeatedly encounters resistance below $87,000, it indicates that it is still trading under the same upward pressure that hindered its rise in early October. In such a case, a weekly rebound will require further consolidation before the direction becomes clearer.
Liquidation levels point to $85,000 and $87,000.
The one-week settlement heat map for CoinGlass shows that Bitcoin rebounded after a sharp drop to $80,400. On the right side of the chart, leveraged positions are still concentrated above that price level, including in the ranges around $85,000 and $87,000.
The highest level is around $87,000. If Bitcoin enters that range, the closing of fragile short positions could amplify the upward trend, but the heat map cannot prove whether buyers will push the price there first.
Below the market, the visible band-like area is still around $82,000 and $80,400. Such a distribution of positions indicates that there is still room for two-way fluctuations, especially when Bitcoin loses the levels it regained during the recent rebound.
A comment article dated October 9th, accompanied by a chart labeled CryptoQuant, claimed that approximately 55,600 BTC units flowed into exchanges in a loss-making state within 24 hours. The article interpreted these transfers as pressure on new holders, while also acknowledging that depositing into exchanges does not necessarily mean that the sale has been completed.
The same comment also mentioned that there were $1.09 billion in crypto liquidations in the market, of which approximately $1.05 billion came from long positions. These figures refer to events across the entire market report, and are not limited to liquidations of Bitcoin alone.
The data transferred into the exchanges adds potential supply concerns from a technical perspective, but it does not prove how many bitcoins have been sold, nor does it indicate whether the holders behind these deposited funds will continue to sell.
U.S. policy remains a catalyst in October
Wallet transfers related to the government have also raised new concerns about supply. According to crypto.news, approximately 833.6 BTC coins, valued at $71.56 million, are being transferred to Coinbase Prime. Of these, about 264.9 BTC coins are related to the Bitfinex case, while 568.7 BTC coins are associated with the confiscation cases of Potapenko and Turogin. This transfer has sparked questions about potential sales, but it has not been confirmed that the sale has been completed yet.
The minutes of the Federal Reserve's September meeting recorded an increase in policy rates by a quarter of a percentage point to the range of 3.75% to 4%, with the next meeting scheduled for October 27th to 28th. The minutes also mentioned the rising yields on U.S. Treasury bonds and the inflationary pressures brought about by oil prices.
Reuters reports that most officials believe it is appropriate to raise interest rates once more before the end of the year, while investors expect no action in October and a rate hike in December. Therefore, a rate hike in October remains a risk, rather than a foregone conclusion.
For the remainder of October, the outlook at the chart level depends on two ranges: support between $79,600 and $80,400, and resistance between $86,500 and $87,000. Holding the support and breaking through the resistance will enhance the possibility of a rebound to $90,000; if the support is lost, attention will shift to the range of $75,000 to $76,000.
Disclosure:This article does not constitute investment advice. The content and materials on this page are for educational purposes only.