Despite the rise on Thursday, the daily trend of AT &T stock remains neutral. The closing price is situated between key moving averages, while hourly indicators show more positive readings. This divergence indicates that a bullish scenario is only likely to form after breaking through the upper resistance level.
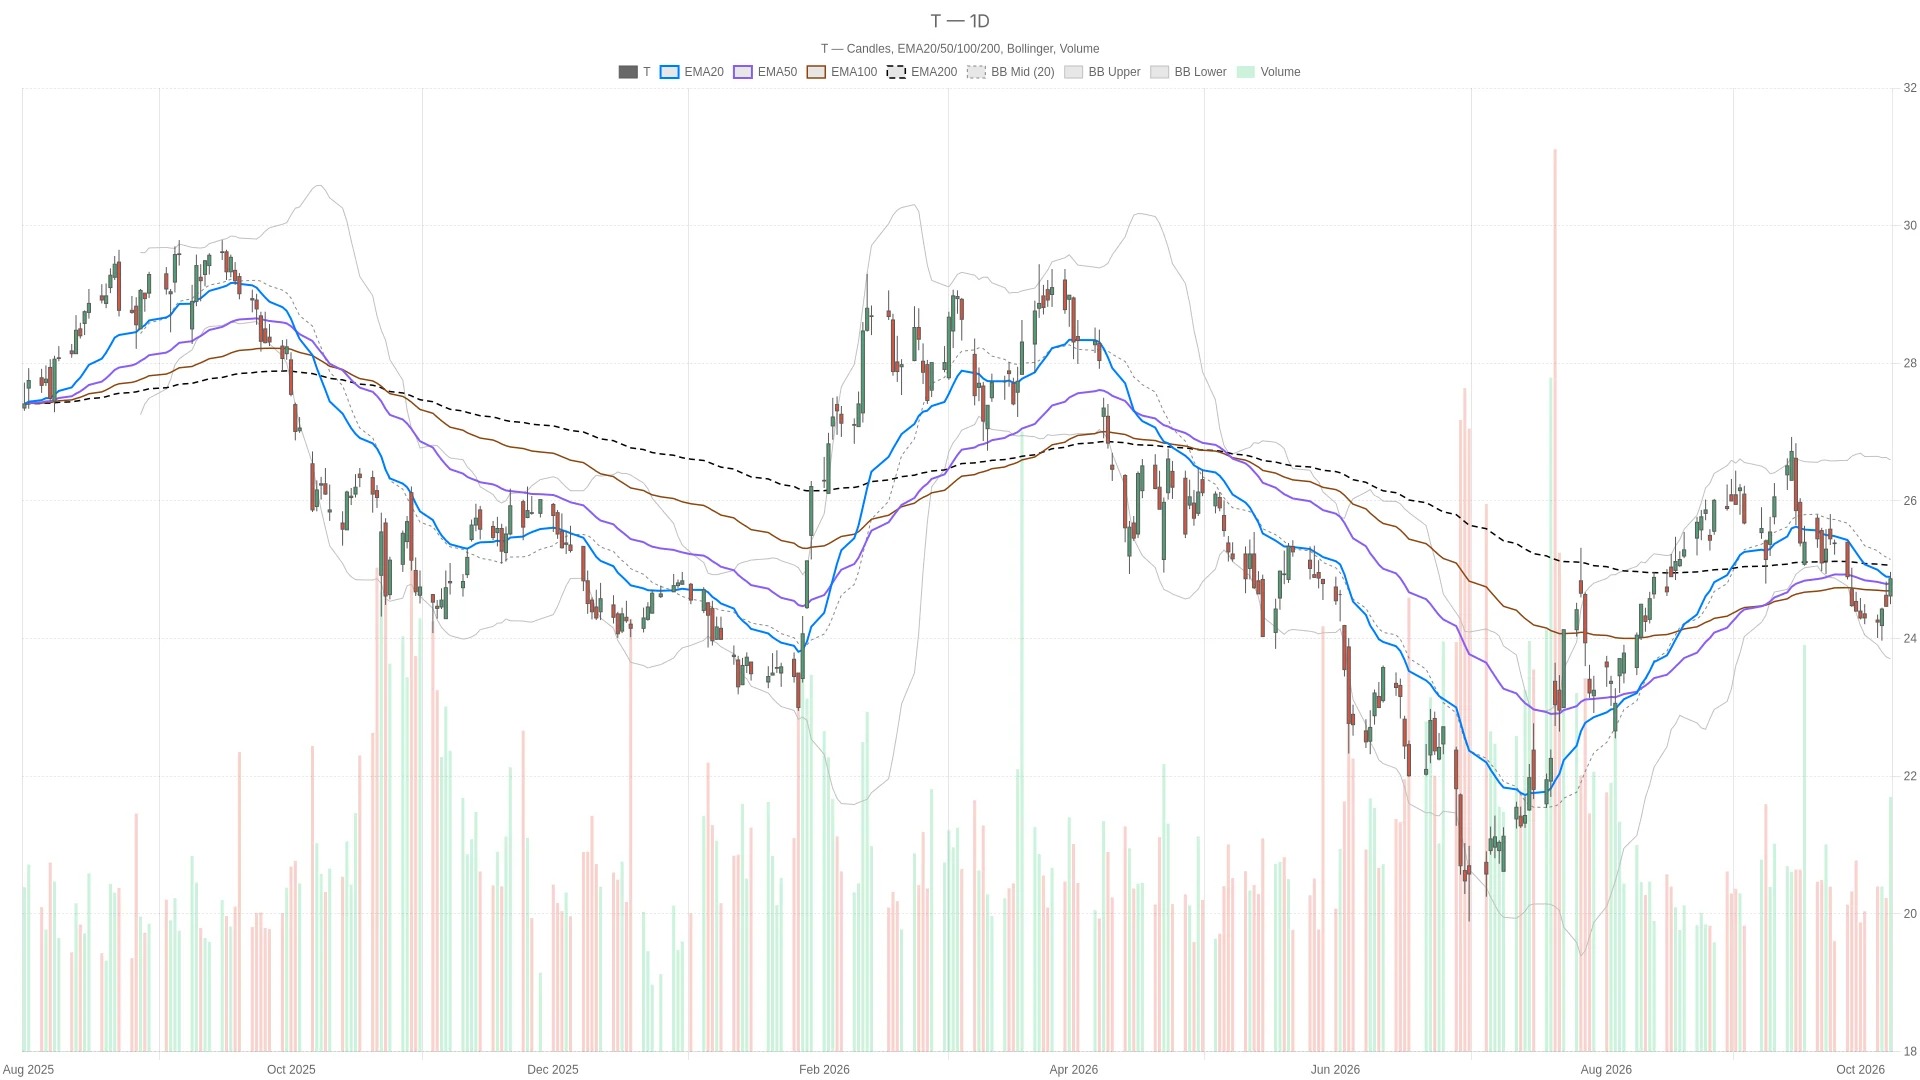
Key Points
- AT closed at $24.87 on Thursday, up 1.63% from the previous closing price of $24.47 on October 7, 2026.
- The closing price was higher than the 50-day exponential moving average of $24.8, but lower than the 20-day exponential moving average of $24.9 and the 200-day exponential moving average of $24.97.
- The daily line RSI14 is at 48.9, which is below the neutral value of 50; the daily line MACD is at -0.21, which is below the signal line of -0.12, and the bar chart shows a value of -0.09, indicating a negative position.
- The hourly RSI14 value is 66.34, while the hourly MACD bar chart shows a value of 0.04, which contrasts with the unconfirmed daily readings.
- An article published by Seeking Alpha on October 7th stated that the price-earnings ratio of AT &T for 2026 is 10.37 times, with a long-term dividend yield of 4.58%.
On Thursday, October 8, 2026, AT &T opened at $24.62, hit a low of $24.50 during the session, and closed at $24.87; the closing price on the previous trading day, October 7, 2026, was $24.47. This represents a 1.63% increase from the previous close. Prices and technical indicators are provided by Twelve Data.
AT & The daily chart structure of T's stock price is somewhat mixed.

The closing price is higher than the 50-day exponential moving average of $24.8, but lower than the 20-day exponential moving average of $24.9. The 200-day exponential moving average of $24.97 is also above. This is not a bullish pattern: the longer-term moving average is higher than the two shorter moving averages, yet the price is still below both of them.
At the same time, the daily line RSI14 is at 48.9, which is just below the neutral threshold of 50. The MACD line is at -0.21, lower than the signal line of -0.12, and the bar chart shows a value of -0.09, indicating a negative trend. These readings suggest that the daily momentum is not sufficient to confirm a bullish outlook.
The middle band of the daily Bollinger Bands is at $25.15, which is also higher than the closing price. The lower and upper bands are $23.71 and $26.59 respectively, indicating that the price is within the band but below the middle band. The daily ATR14 is 0.5 dollars, which only provides a reference for volatility and has not formed a directional bias.
The hourly strength has not resolved the daily resistance.
In contrast, the closing price is higher than the 20-hour exponential moving average of $24.6 and the 50-hour exponential moving average of $24.59, but it is still below the 200-hour exponential moving average of $25.02. The hourly structure supports the bullish side on a shorter time frame, but it is not completely consistent.
The hourly RSI14 is at 66.34, which is above 50 but has not yet entered the overbought zone. The hourly MACD line is at 0.12, which is 0.07 higher than the signal line, and the bar chart shows 0.04. This conflicts with the negative value bars on the daily MACD chart, but it does not override the daily perspective.
It is worth noting that the closing price was above the middle band of the hourly Bollinger Bands at $24.56, but below the upper band at $24.96. The hourly ATR14 value is $0.16. Even though the hourly momentum is positive, the resistance above remains significant.
In terms of execution background alone, the 15-minute moving averages are in a bullish alignment, and the price is above them. The 20-period 15-minute exponential moving average is at $24.79, which is higher than the 50-period 15-minute exponential moving average of $24.66 and the 200-period 15-minute exponential moving average of $24.64. RSI14 is at 61.73, which is above 50 but not considered overbought. The price is also above the middle band of the 15-minute Bollinger Bands at $24.76, but below the upper band at $25.05. ATR14 is at $0.08.
Fiber optic service messages provide context, but they cannot serve as a catalyst for prices.
A report published on Wednesday, October 7th, by Yahoo Finance stated that AT &T agreed to merge its Gigapower assets into a new fiber optic joint venture. The partners in this venture are Global Infrastructure Partners and CPP Investments. Yahoo Finance reported that the goal of this project is to cover over 60 million locations by 2030, with AT &T holding a 50% stake in the company. Another report described this joint venture as aimed at supporting deleveraging and growth.
At the same time, an article published by Seeking Alpha on October 7th argued that the valuation of this stock is too low. Seeking Alpha cited a valuation of 10.37 times earnings for 2026, as well as a prospective yield of 4.58%. These are the valuation opinions of that media and do not constitute confirmation of a rise from a technical perspective. A report published by Investing.com after the close on Thursday described AT &T stock as declining, but the summary provided did not give any specific reasons for this decline.
Bullish and bearish conditions for the next trading day
Pivot Points and Intraday References
When trading resumes, the daily pivot level is $24.78, the first resistance level is $25.06, and the first support level is $24.59. The hourly pivot level is $24.86, the first resistance level is $24.91, and the first support level is $24.84. The 15-minute pivot level is also $24.86, with the first resistance level at $24.91 and the first support level at $24.84. These are reference levels for the next trading session and are not obstacles that have already been formed during Thursday's trading.
Resistance on the daily chart above
The bullish scenario requires holding above the 50-day exponential moving average of $24.8, and breaking through the 20-day exponential moving average of $24.9. Further up, the 200-day exponential moving average of $24.97 and the 200-hour exponential moving average of $25.02 are still above. If it can break through the first daily resistance of $25.06 as well as the middle band of the daily Bollinger Bands at $25.15, this judgment will be strengthened. A rise in the daily RSI above 50, and the MACD line above the signal line, will also provide further confirmation.
Support level and downward reference
On the contrary, if it falls below the 50-day moving average of $24.8 and the daily pivot point of $24.78 for the next trading session, the bullish scenario will weaken. If it further drops below the first support level of $24.59 and the intraday low of $24.50, then this support scenario will become invalid. The lower band of the daily Bollinger Bands at $23.71 serves as a reference for further declines, but it is not an expected target.
Overall, AT &T is above the daily support level, but still below several nearby resistance levels. The daily ATR14 at $0.5 defines the range of fluctuations, while the positive readings on the hourly chart contrast with the unconfirmed bullish scenario on the daily chart. Whether the price can break through these upper levels remains to be seen.
Frequently Asked Questions
AT Where will the &T stock close on Thursday?
AT &T closed at $24.87 on Thursday, October 8, 2026, up 1.63% from the previous closing price of $24.47 on October 7.
What is the key resistance level for AT &T stock?
The 20-day exponential moving average on the daily chart is $24.9, the 200-day exponential moving average on the daily chart is $24.97, the 200-hour exponential moving average on the hourly chart is $25.02, the first resistance level on the daily chart is $25.06, and the middle band of the Bollinger Bands on the daily chart is $25.15, all of which are above the closing price of $24.87 on Thursday.
Seeking Alpha What does AT say about &T?
What about the daily technical analysis of AT &T?
The daily line RSI14 is at 48.9, which is below the neutral value of 50. The MACD line is at -0.21, which is below the signal line of -0.12, and the bar chart shows -0.09. The closing price of $24.87 is higher than the 50-day exponential moving average of $24.8, but lower than the 20-day exponential moving average of $24.9 and the 200-day exponential moving average of $24.97.
Cryptonomist and the author do not hold any positions in the financial instruments mentioned in this text, nor have they received any compensation from the companies reported.
This article was generated with the assistance of artificial intelligence and has been reviewed by an editorial team.