

Outlook for October 8th (Thursday)
Just 24 hours after analysts stated that for Bitcoin to clearly break above $87,000, there needed to be a large influx of funds into the spot market, data showed that market sentiment was developing in the opposite direction.
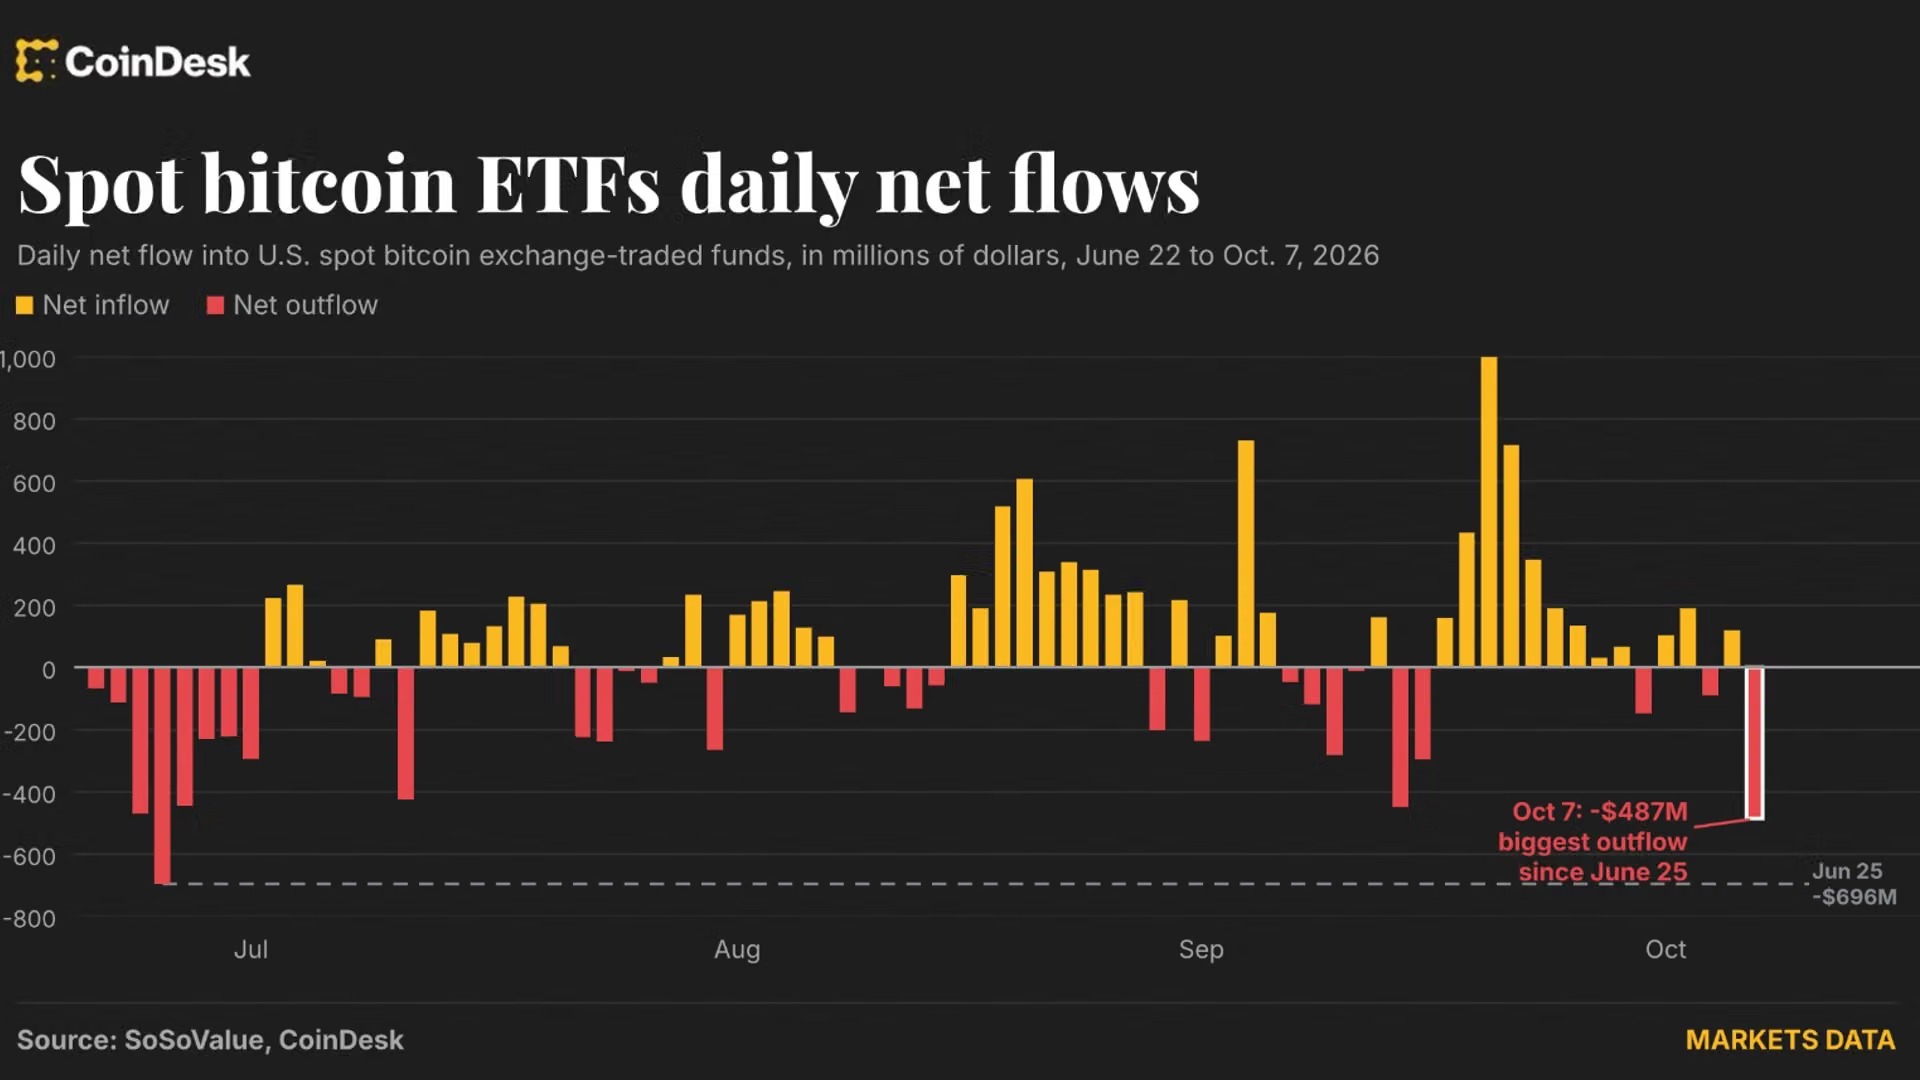
According to statistics from data provider SoSoValue, on Wednesday, there was a net outflow of $487.1 million in US spot ETF, marking the largest single-day outflow since June 25th.
Recently, the flow of funds has become more volatile. Following a net inflow of approximately $2.65 billion in September, there has been a net outflow of $165.6 million so far in October. Over the past six trading days, the flow of funds has fluctuated between slight net inflows and net outflows.
Analysis data from CoinDesk shows that the outflow on Wednesday was exceptionally large, being about 2.1 standard deviations lower than the average daily inflow over the past 90 days. The average daily inflow over the past 90 days was approximately 92 million US dollars. According to normal distribution, about 95% of observed values should fall within two standard deviations of the mean. Such a larger fluctuation indicates that this was a rare or exceptionally significant event.
As of now, since the beginning of this year, these funds have seen a cumulative net inflow of $717 million; considering that in July the cumulative net outflow once reached $5.76 billion, this buffer is not very substantial. Since these funds began trading in January 2024, the cumulative net inflow has been $57.33 billion.
Currently, Bitcoin is trading around $83,000, hovering near the price bottom formed after the upward trend stalled on September 21st. Analysts say that if the price continues to fall below this range, it could drop to $80,000, disrupting the stable bullish stair-step pattern on the daily chart.
FxPro Chief Market Analyst Alex Kuptsikevich stated in an email: "The range of $80,500 to $81,500 covers last month's local high and the 50-day moving average. It may not be difficult for bears to push prices into this area. What is worth close attention is whether this region will attract buyers looking for opportunities to buy on dips, or whether it will force buyers holding margin positions to close their trades."
He added, "If it's the first scenario, we can expect prices to quickly retest the highs; if it's the second scenario, then there could be a sharp drop to $76,000 (the recent low) or $72,000 (the 200-day moving average), similar to a high-speed elevator."
He also stated that the relatively high volatility in U.S. Treasury yields, as well as the potential escalation of tensions between the United States and Iran which could drive up oil prices, are both potential negative factors. Amidst all this, the weakened cash flow of the spot ETF funds, which played a major role as buyers during the rebound from August to September, could come at a cost. Stay vigilant!
For further reading
- For analysis of today's counterfeit coin and derivative activities, please refer to "Crypto Markets Today". For a complete list of events this week, please see "Crypto Week Ahead" in "CoinDesk".
- CoinDesk reports that Bitcoin loans are being used to pay tuition fees and as working capital, not just for transactions; lending institutions indicate that Bitcoin-backed financing is maturing and becoming more and more like traditional loans, being used as collateral to borrow money for real-world expenses.
- CoinDesk reports that as the White House requested the Pentagon to provide plans for strikes against Iran, Bitcoin fell below $82,800, while oil prices rose, pushing U.S. Treasury yields back to near their highest levels since 2002.
- Reuters reported that after the minutes of the Federal Reserve meeting showed that policymakers believed inflation was the biggest risk facing its outlook, the US dollar rose to near a 18-month high; at the same time, rising oil prices and increasing bond yields in the eurozone dragged down the euro.
- Bloomberg reported that rising oil prices triggered a new wave of selling in the stock and bond markets, and even Samsung Electronics' record profits failed to attract investors to buy risky assets.
Today's Signal
The chart shows that since July, the intraday price fluctuations of Bitcoin have been presented in the form of candlestick charts, with a 50-day average price superimposed on top, represented by a yellow line.
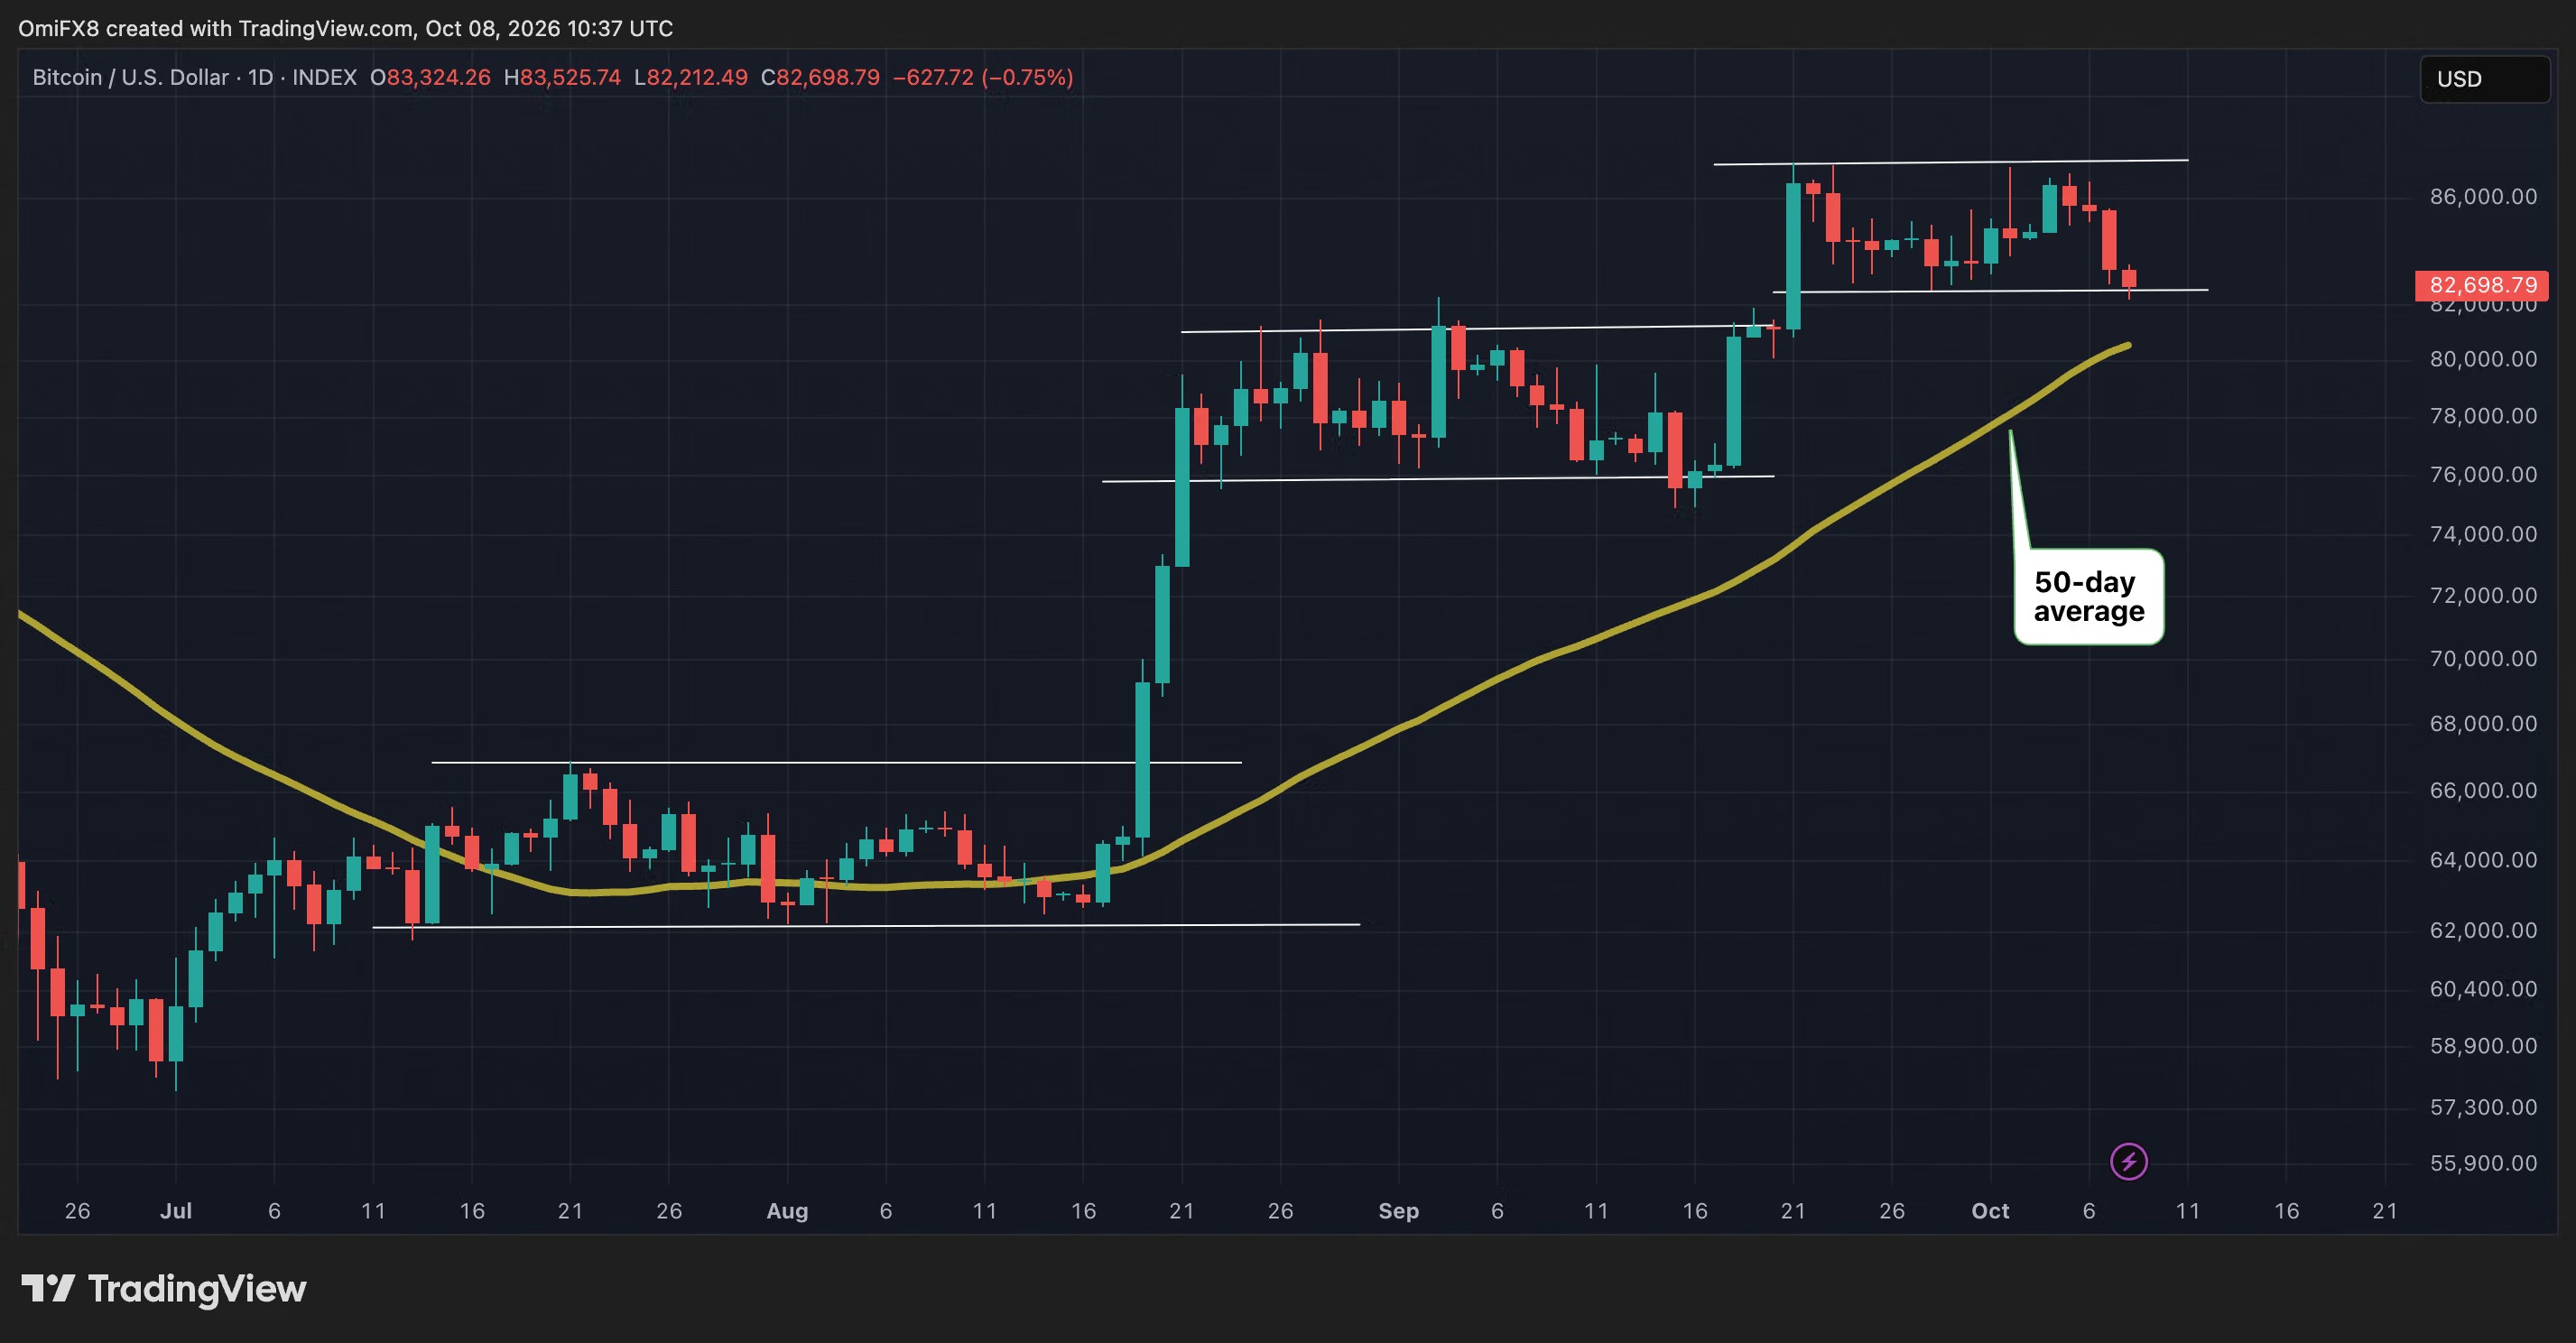
BTC is currently trading near the lower edge of the recent consolidation range. If it breaks down, it will confirm that the consolidation has ended in a bearish manner and may trigger selling pressure, with the target being the 50-day moving average at 80,550 US dollars.