As of 09:59 on Tuesday Eastern Time, Olenox stock ( OLOX ) was trading at $1.38, representing a 56.82% increase from the previous trading day's closing price of $0.88. The stock opened at $1.44 that day, with a trading range of $1.33 to $1.54, and a trading volume of 268,492 shares. A search for recent reports did not yield any specific company-related news.
Key Points
- The daily line RSI14 is at 56.26, which is higher than the neutral 50-line; the daily line MACD bar chart shows 0.13, and the MACD line shows -0.24.
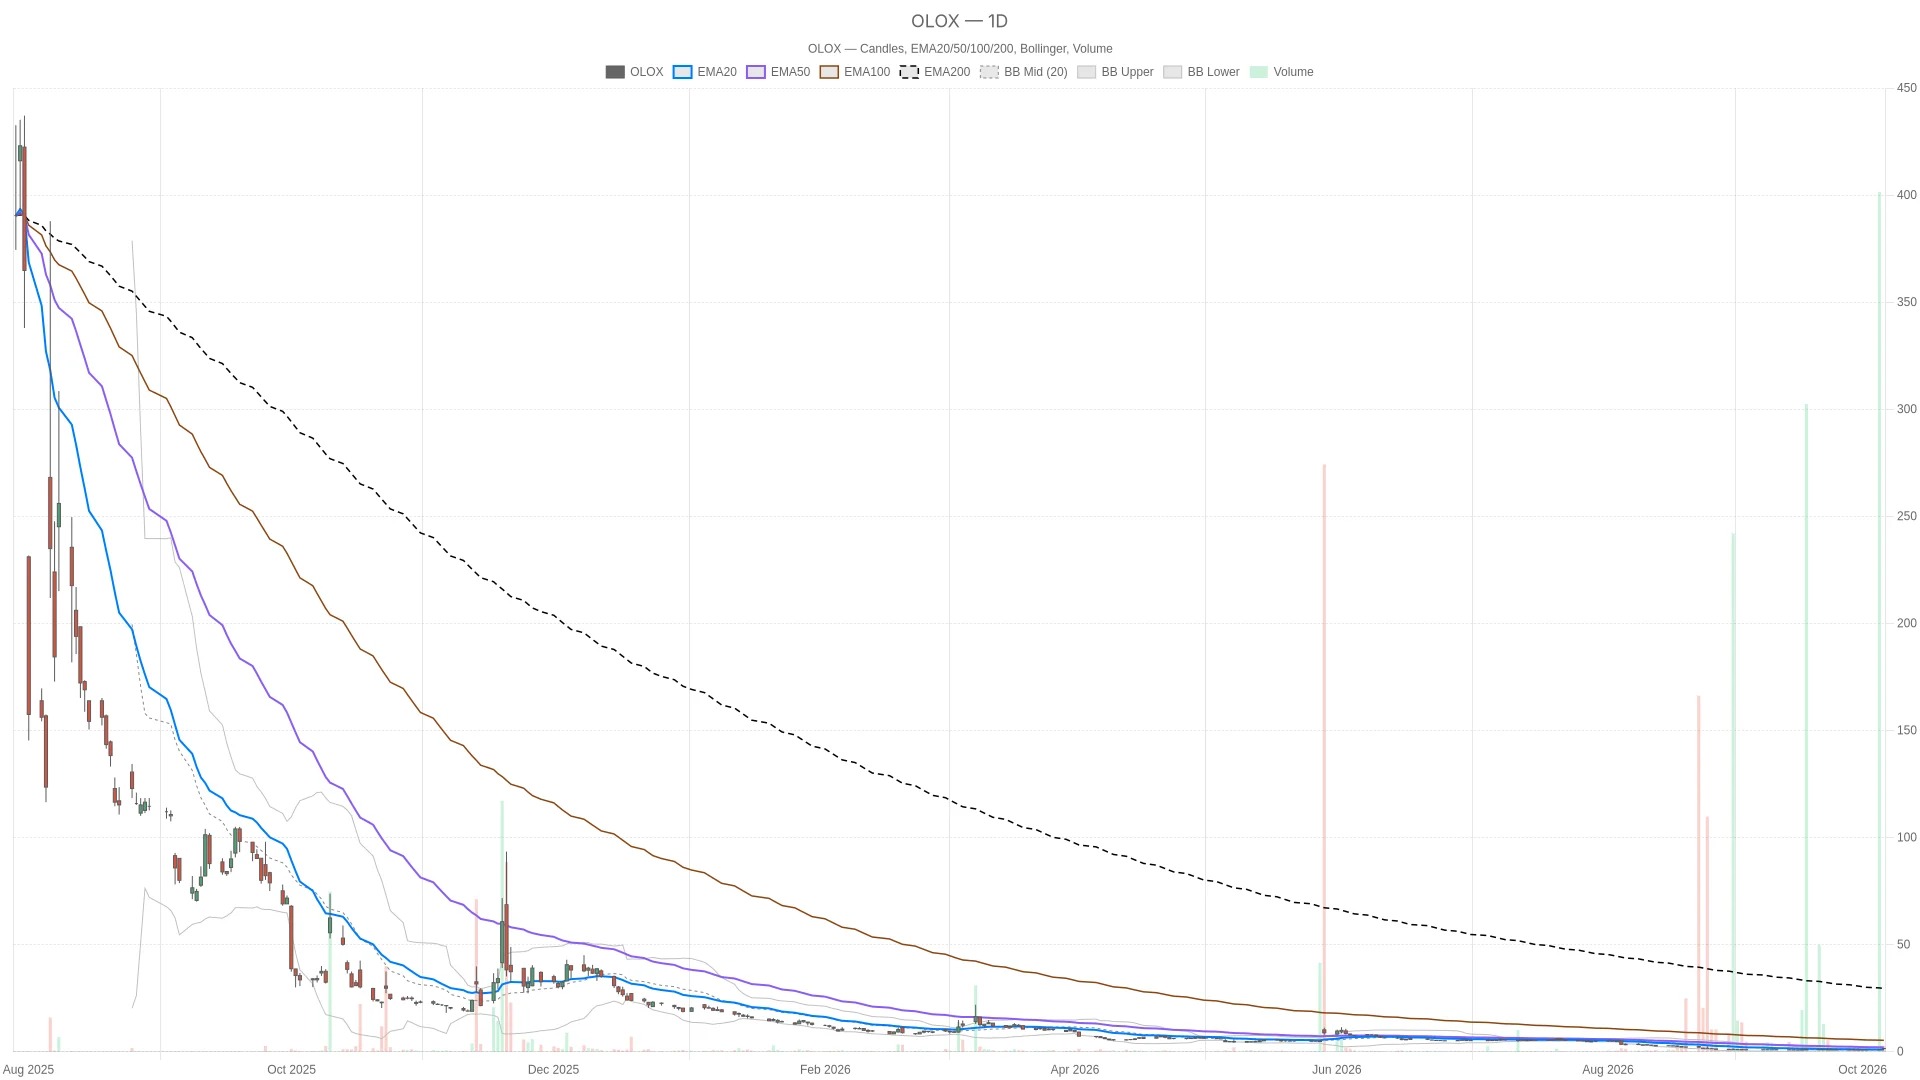
- The stock price is higher than the 20-day EMA of $1.04 and lower than the 50-day EMA of $2.01.
- The hourly chart RSI14 rose to 90.41, far above the overbought range of 70, while the MACD bar chart shows a value of 0.04.
- On the 15-minute chart, the stock price of $1.38 is located between S1 $1.36 and the pivot point of $1.45, with the moving averages arranged in a clear bullish pattern.
Olenox Stock Price: Despite a sharp rise, the daily chart still shows divergence
Despite a significant rise during the session, the signals on the daily chart remain divided. RSI14 has risen back above 50, but MACD is still below the zero line.
RSI14 has risen from 32.43 to 56.26, returning above the neutral 50-line again, but it is still significantly below the overbought threshold of 70. The MACD line is at -0.24, and the signal line is at -0.37, keeping the bar chart in a positive value of 0.13, which is an increase from the previous 0.10. It is worth noting that the MACD line itself is still below the zero axis, so the broader daily trend has not yet fully turned bullish.
Trend positions also show a similar divergence. The stock price of $1.38 is higher than the 20-day moving average of $1.04, which was previously at $1.00; however, the stock price is still lower than the 50-day moving average of $2.01. In other words, the price is currently sandwiched between the two moving averages and not clearly aligned in one direction. Therefore, the daily chart structure still indicates divergence, rather than a clear bullish trend.
It is worth noting that the daily ATR14 level is at $0.20. At the same time, the current stock price is already above the upper band of the daily Bollinger Bands at $1.14, with the middle band at $0.88 and the lower band at $0.62. The daily pivot point is at $0.87, R1 is at $0.91, and S1 is at $0.84. These levels were calculated based on the trading session on October 5th, but the current price has far exceeded these three reference points. The stock has clearly broken through the reference range it was in before today's opening.
Hourly chart confirms upward momentum, but indicates overbought condition

The hourly chart confirms the strong momentum behind this surge, but RSI14 is already in a deeply overbought area. However, the moving average structure has not yet fully formed a bullish arrangement.
RSI14 has risen from 61.06 to 90.41, having deeply entered the overbought area above 70. The MACD line is at 0.05, which is 0.02 higher than the signal line, and the bar chart has risen to 0.04 from a previous value of 0.00. These readings indicate that there is more momentum at the hourly level.
However, the trend structure on the hourly chart is not ordinary. The 20-hour EMA has risen to $0.90, from a previous value of $0.85; the 50-hour EMA is at $0.87; and the 200-hour EMA is at $1.26. The stock price of $1.38 is above all three moving averages, but the 200-hour moving average is still higher than the 20-hour and 50-hour moving averages. In other words, the longer-term hourly moving averages have not yet been completely surpassed by the shorter-term moving averages. Although the price itself has reached all these levels, this does not constitute a completely standard bullish pattern, which also complicates the picture of strong momentum.
15-minute chart: Execution environment near the pivot point
The 15-minute chart shows a complete bullish EMA structure, but the stock price is still below the pivot point of $1.45.
After scaling down to a 15-minute chart, it is mainly used to determine timing rather than direction, and the graphs become more cautious. RSI14 has fallen from 91.65 to 79.93, which is still above 70; therefore, although it has dropped from the previous value, the overbought condition still exists.
Unlike the hourly chart structure, the 15-minute chart shows a complete bullish pattern. The stock price of $1.38 is higher than the 20-period moving average of $0.97, which in turn is higher than the 50-period moving average of $0.90. The 50-period moving average is also higher than the 200-period moving average of $0.86. The MACD line is at $0.09, which is $0.03 higher than the signal line; the bar chart shows a value of $0.05, with the previous value being $0.04. Both values are positive.
However, the pivot levels for this period indicate a more cautious signal. The 15-minute pivot point is $1.45, R1 is $1.57, and S1 is $1.36. The stock price of $1.38 is located between S1 and the pivot point, closer to S1, and below the pivot point itself. This means that the price is still below the pivot point, while RSI14 remains above 70, and the 15-minute ATR14 is $0.07.
Bullish scenario
To continue the upward trend, the price needs to re-establish itself above the 15-minute pivot point of $1.45 and break through $1.57, while also maintaining a level above the 200-hour EMA of $1.26.
For the upward movement to be more credible, the price first needs to regain the 15-minute pivot point of $1.45, and then it must break through $1.57. On the hourly chart, maintaining a level above the 200-day support of $1.26 will sustain the current trend. On the daily chart, a confirmation signal will come from the price remaining above 50. Even if it is still below the 50-day moving average of $2.01, the price still needs to stay above the 20-day moving average of $1.04.
Bearish scenario
If it falls below $1.36, which is the 15-minute S1, it may test the intraday low of $1.33. A deeper risk would point to the 20-day EMA of $1.04 on the daily chart.
On the other hand, if it falls below the 15-minute S1 of $1.36, there will be a chance for the price to retest the intraday low of $1.33. If that level is lost, the next more important support level below is the 20-day EMA of $1.04 on the daily chart. That would mean a deeper pullback, essentially wiping out most of today's intraday gains. If the daily RSI14 falls back below 50, it will further weaken the reasons for a continuation of the upward trend; the same would apply if the daily MACD bar chart turns negative.
Olenox Summary of Key Stock Price Levels
Overall, as of 09:59 Eastern Time, the stock price of Olenox was reported at $1.38, representing a 56.82% increase from the previous closing price of $0.88. To date, the trading range has been between $1.33 and $1.54, with a trading volume of 268,492 shares.
The stock price is trading above the upper band of the Bollinger Bands on both the daily, hourly, and 15-minute charts.
On the daily chart, there is still a divergence between the two main moving averages; the hourly chart confirms the momentum, but the arrangement of the moving averages is not conventional; the 15-minute chart shows a clear bullish EMA pattern, while the stock price is precisely below its own pivot point.
Whether this upward movement will ultimately extend to the $1.57 resistance level on the 15-minute chart, or whether it will fall back to the $1.04 level of the 20-day EMA on the daily chart, is still unknown at present.
Frequently Asked Questions
What is the current price of Olenox stock?
As of 09:59 Eastern Time, the stock of Olenox was reported at $1.38, representing a 56.82% increase from the previous closing price of $0.88.
What does the daily line indicator show?
The daily line RSI14 is at 56.26, which is above the neutral 50-day line; the MACD line is at -0.24, still below the zero axis. The stock price is higher than the 20-day EMA of $1.04, but lower than the 50-day EMA of $2.01.
Is it overbought on the hourly chart?
The hour RSI14 is at 90.41, having deeply entered the overbought range above 70. The MACD bar chart shows a positive value of 0.04.
What key levels need to be monitored?
On the 15-minute chart, the support level is S1 at $1.36, the resistance level is R1 at $1.57, and the pivot point is $1.45. On the daily chart, the 20-day EMA at $1.04 and the 50-day EMA at $2.01 are the main reference levels.
Cryptonomist and the author do not hold any positions in the financial instruments mentioned in this text, nor have they received any compensation from the companies reported.
This article was generated with the assistance of artificial intelligence and has been reviewed by an editorial team.