As of 09:55 on Tuesday ET, the stock price of SpaceX was reported at $174.70, up 2.11% from the previous closing price of $171.09. The stock opened at $172.09 and fluctuated between $172.00 and $176.41 during the session, with the latest price being $174.70.
Key Points
- As of 09:55 on Tuesday ET, the stock price of SpaceX was reported at $174.70, up 2.11% from Monday's closing price of $171.09.
- The daily line RSI14 is at 70.74, higher than Monday's 68.93, entering an overbought zone.
- The hourly chart RSI14 shows a value of 81.03, which is higher than 77.78, indicating that it is further in the overbought zone compared to the daily chart readings.
- Daily chart: MACD bar chart expanded to 2.01, previous value was 1.13; MACD line chart shows 5.45, which is above the signal line of 3.44.
- The stock price is above the upper band of the daily Bollinger Bands at $167.66, above the daily pivot point at $167.39, and below the daily R1 at $176.17.
On the daily chart, there is a confirmation of an excess, but the momentum has become quite strong.
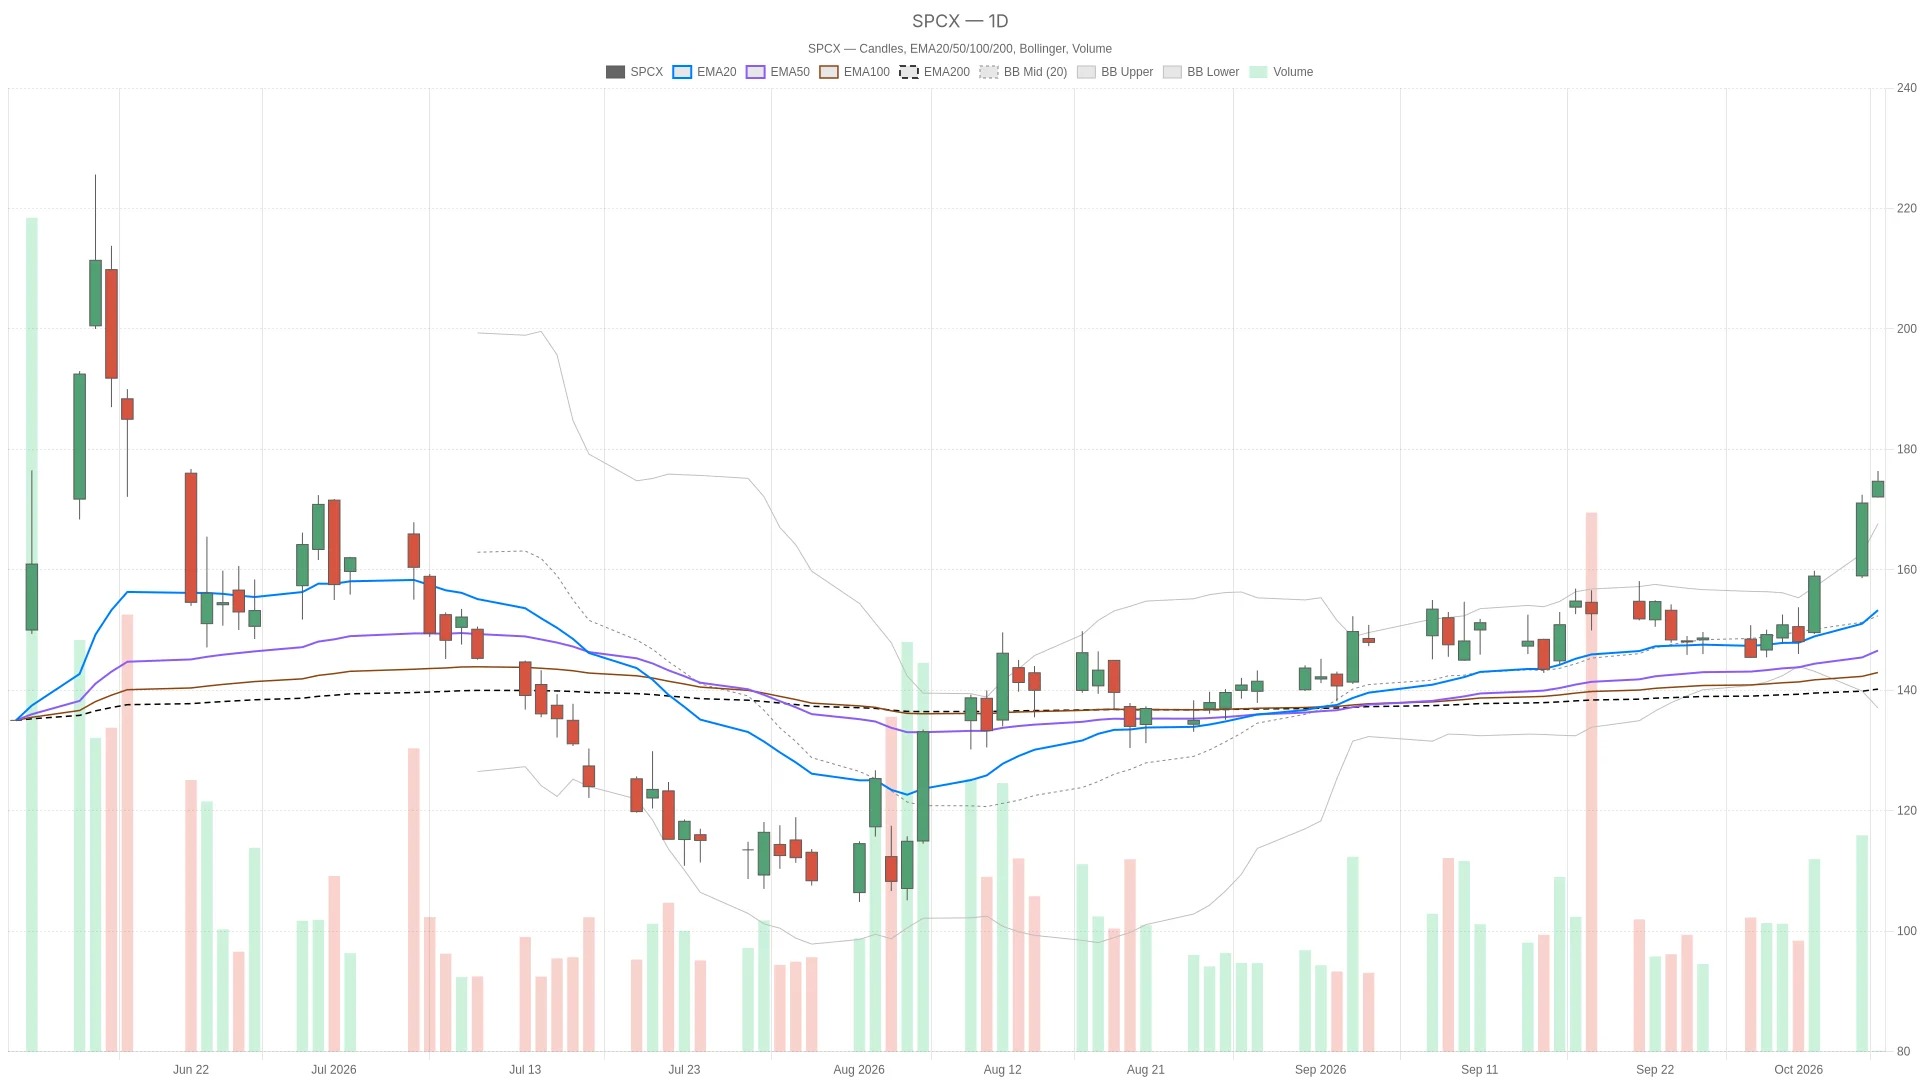
The daily chart confirms a bullish trend: The stock price is above two key moving averages, but the momentum indicators are sending out overbought signals. The stock is above the 20-day EMA of $153.32 and the 50-day EMA of $148.39, confirming an upward trend that is driving the stock price higher. The 20-day EMA itself has also risen from $151.07 to $153.32.
The daily line RSI14 is at 70.74, up from 68.93, indicating an overbought area. The daily line MACD bar chart has expanded to 2.01, with a previous value of 1.13. The MACD line report shows 5.45, which is higher than the signal line of 3.44, indicating an upward trend. The MACD line leads the signal line.
At the same time, the price of around $174.70 is higher than the upper Bollinger Band level of $167.66 on the daily chart. Above this upper band, the middle Bollinger Band level is $152.35, and the lower band is $137.04. The price breaking through the upper band indicates that a stretching condition has occurred on the daily chart.
The hourly chart continues the pattern that is more consistent with the daily chart.

The hourly chart reinforces the pattern presented by the daily chart. The stock price is above the 20-hour EMA 162.67 USD level, and this moving average is also higher than the 50-hour EMA 156.60 USD level, which in turn is above the 200-hour EMA 148.51 USD level, forming a complete bullish arrangement. The structure at the hourly level is predominantly bullish, in line with the daily trend.
However, the hourly chart RSI14 shows a value of 81.03, which is higher than 77.78, indicating that it is still in an overbought zone more significantly than the daily chart reading. The bar chart for the hourly chart MACD has risen to 1.26, from a previous value of 1.15, and the line chart MACD shows 5.49, which is higher than the signal line of 4.24. The stock price is below the upper band of the hourly Bollinger Bands at 176.39 USD, but significantly above the middle band of 160.42 USD.
Comparing the hourly pivot points: pivot point at $170.92, R1 at $172.65, S1 at $169.36, SpaceX – the stock price has now surpassed R1. It is noteworthy that in the hour ATR14, the price rose from $2.48 to $2.68, reflecting an increase in intraday volatility today.
In short, both the daily and hourly charts are pointing in the same direction. However, the RSI readings for both are firmly in the overbought zone, with the hourly chart being even more extreme. This combination of consistent trend and stretched momentum is the core contradiction of the current trend.
15-minute chart: The execution level is more volatile.
On the 15-minute chart, a bullish pattern is also maintained. The price is above the 20-period EMA of 169.08 USD, and this moving average is in turn higher than the 50-period EMA of 164.41 USD and the 200-period EMA of 156.05 USD. The 15-minute structure also favors the bulls.
At the same time, the 15-minute RSI14 is at 79.00, which is in an overbought range. The 15-minute MACD bar chart has risen to 0.35, from a previous value of 0.24, and the MACD line report shows 2.62, which is higher than the signal line of 2.26. The stock price is above the 15-minute Bollinger Band upper band of $173.69, indicating an excessive extension in the short term for this trading cycle.
Compare with the 15-minute pivot point: the pivot point is $174.52, R1 is $177.04, S1 is $173.26, SpaceX; the stock price is slightly above the pivot point and below R1. In the 15-minute period of ATR14, the price rose from $1.40 to $1.49, reflecting an accelerated short-term fluctuation rhythm.
News stream surrounding the stock price of SpaceX
According to a report released by CNBC before the opening on Tuesday, options traders believe that from now until July, the probability of SpaceX reaching $225 is less than 50%. This estimate is based on current options pricing.
An article published before the opening on Tuesday suggested that the stock is worth buying. The article pointed out that SpaceX had a computing power capacity of 1.4 GW at the end of the second quarter. It also mentioned that management believes this capacity could approach 10 GW by 2027.
On Monday, another Seeking Alpha report stated that SpaceX is seeking approval to build a natural gas pipeline in Florida. The application has been submitted to the state regulatory authorities, and the pipeline will provide fuel for Starship rockets launched from Cape Canaveral. Also on Monday, CNBC reported that the stock price of SpaceX had risen to its highest level in six months. The report noted that the stock had rebounded by nearly 60% from its low point at the beginning of August. The report linked this rebound to the company's AI business and the progress of Starship. It was also mentioned that this trend has once again made Elon Musk a trillionaire.
SpaceX Bullish Scenario for Stock Prices
The bullish scenario is based on the existing structure. If the SpaceX stock price breaks through the daily line of R1 at $176.17, it will then face a 15-minute target of R1 at $177.04. If both targets are broken through, it indicates that the stock price has crossed the recent upper reference points in both time frames. If the daily chart MACD continues to show positive values and the hourly chart RSI14 remains above 50, it can be considered that the broader trend structure is still intact. The continuous bullish alignment of moving averages on the daily, hourly, and 15-minute charts will also support the judgment that the upward trend of SpaceX stock price is still structurally sound.
Bearish scenarios and what circumstances would negate this round of gains
On the other hand, a weakening of the upward momentum will first need to be evident on a shorter time frame. If it falls below $173.26 at the 15-minute S1 level, that would be an early signal, especially if it is accompanied by a decline back to around 50 at the same 15-minute RSI14 level.
On the daily chart, if it falls below the pivot point of $167.39, it will weaken the broader bullish outlook. A further decline would mean that the price loses support at the hourly level of $162.67 – this moving average is currently supporting the bullish trend at the hourly time frame – and then it would fall below the daily level of $162.32. If it breaks below the daily level of $162.32, the 20-day moving average would be at $153.32. If the daily chart falls below $70, it would indicate a reversal from the current overbought condition.
Closing Summary
Overall, the stock price of SpaceX is reported at $174.70. It is above the pivot points on both the daily, hourly, and 15-minute charts, as well as above the upper Bollinger Bands on these same charts. The daily ATR14 value is 7.19, while the hourly ATR14 value is 2.68, indicating some volatility.
The trend structures across the three time frames are all consistently upward. Recent reports have also added to this generally positive context, including the bullish views cited by Yahoo Finance from Morgan Stanley, as well as the bullish arguments related to the expansion of computing power mentioned in Seeking Alpha and SpaceX. At the same time, the level of 70.74 on the daily chart RSI14 and 81.03 on the hourly chart RSI14 indicate that there is limited room for error. Where the next wave of trends will take the stock price remains an unsettled question.
Frequently Asked Questions
What does overbuying of RSI reading pairs with SpaceX stock prices mean?
The daily line RSI14 is at 70.74, and the hourly line RSI14 is at 81.03, both of which are in overbought territories. Although the trends on the daily, hourly, and 15-minute charts are still consistently upward, these relatively high readings indicate that momentum has far exceeded the neutral level in both time frames.
What are the key price levels to watch for the stock price of SpaceX?
On the daily chart, the pivot point is $167.39, R1 is $176.17, and S1 is $162.32. On the 20-day chart, EMA is $153.32. On the hourly chart, after 20 hours, EMA is $162.67. On the 15-minute chart, S1 is $173.26, and R1 is $177.04.
What are the latest news regarding the stock price of SpaceX?
Yahoo Finance reported on Morgan Stanley's bullish view before Tuesday's market open, stating that the bank is one of the most bullish institutions on Wall Street. Seeking Alpha believes the stock is worth buying, citing its second-quarter computing power capacity reaching 1.4. GW. CNBC points out that, based on current option pricing, option traders believe there is less than a 50% probability that SpaceX will reach $225 by July.
Cryptonomist and the author do not hold any positions in the financial instruments mentioned in this text, nor have they received any compensation from the companies reported.
This article was generated with the assistance of artificial intelligence and has been reviewed by an editorial team.