Space Exploration Technologies stock ( SPCX ) closed at $158.96 on Friday, up 7.35% from Thursday's closing price of $148.07. The trading range for the day was from $149.34 to $159.84. Calculated based on the opening price of the session, the increase of about 6.28% indicates that most of the rise occurred during trading hours.
Key Points
- SPCX rose 7.35% on Friday, closing at $158.96, with the intraday range being from $149.34 to $159.84.
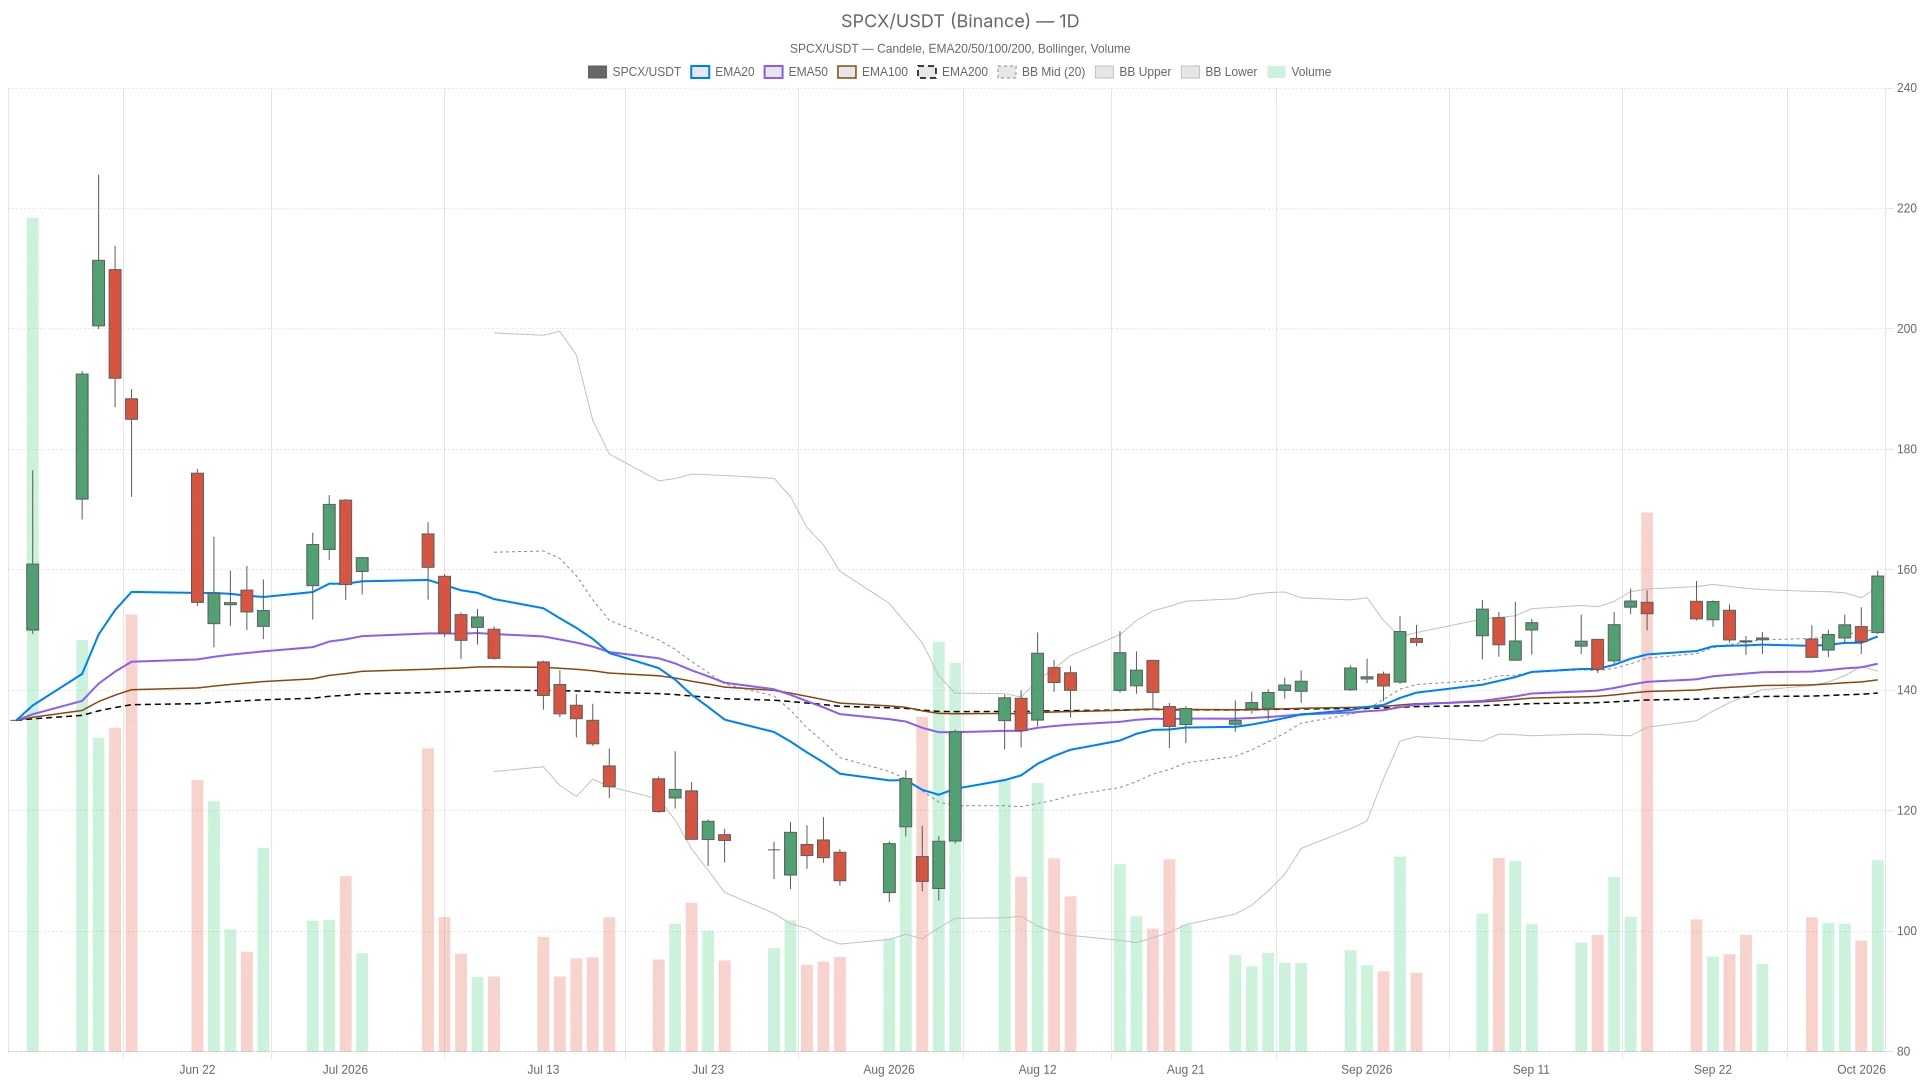
- The stock price closed above the upper band of the daily Bollinger Bands at $157.11, indicating that the breakout has continued.
- The daily line RSI14 is at 61.48, which is still on the high side, but below the overbought range of 70 and above.
- The hourly chart EMA shows a clear bullish pattern: the 20-hour EMA is higher than the 50-hour EMA, which in turn is higher than the 200-hour EMA.
- The daily MACD bar chart shows -0.03; although there has been a breakout, the momentum is still slightly diverging.
The overall judgment provided by the daily chart is clearly bullish, but it seems to be somewhat stretched. On Friday, the closing price was above both the 20-day moving average of $148.96 and the 50-day moving average of $146.35. The price remaining above these two moving averages indicates a relatively strong position structure; however, since the longer-term moving averages are not shown in the chart, it cannot yet be considered a complete bullish trend signal. The daily moving average of RSI14 is at 61.48, which is clearly bullish, but it has not yet entered the overbought range above 70. This means that, based solely on this indicator, the momentum is not excessively stretched.
Daily breakout pushes Space Exploration Technologies stock above the upper band of the Bollinger Bands

Space Exploration Technologies The stock closed above the upper band of the daily Bollinger Bands on Friday, confirming that this breakout is now in an extended phase. The middle band is at $150.13, the upper band at $157.11, and the lower band at $143.15. The closing price of $158.96 on Friday was firmly above the upper band, indicating a rapid upward movement rather than a gradual climb. The daily ATR14 indicator was at 6.83, which is consistent with the approximately $10 fluctuation from low to high during the day and significantly higher than the usual intraday range.
However, the daily chart MACD provides a slight signal of caution. The MACD line is at 2.62, slightly below the signal line of 2.65, forming a negative bar chart of -0.03. The actual implication is that, although the price has reached a new high, the momentum on the daily time frame has only weakened slightly. This is more of a minor deviation that deserves attention, rather than a reversal signal. For the next trading day, the daily pivot point is at $156.05, the first resistance level is at $162.75, and the first support level is at $152.25.
Hourly chart momentum confirms an upward trend.
Moving to the hourly chart, the pattern further strengthens the bullish outlook, with EMA arranged neatly. The price is above the 20-hour EMA of $154.10, and the 20-hour EMA is also higher than the 50-hour EMA of $151.80, which in turn is above the 200-hour EMA of $146.59. The hourly RSI14 is at 67.89, close to overbought territory but not yet there. Meanwhile, on the hourly chart, the MACD line at 2.44 is higher than the signal line at 1.65, forming a positive bar chart of 0.79.
This comparison is very important. On the hourly chart, the MACD bar chart shows a value of 0.79, which contrasts with the weaker MACD reading on the daily chart. This indicates that the decline in daily momentum is merely a temporary fluctuation within a stronger intraday trend, rather than a significant reversal at a larger scale. On the hourly chart, the lower Bollinger Band is at $146.02, the upper band is at $160.56, and the middle band is at $153.29. The closing price on Friday was still below the upper band, suggesting that there is room for further price expansion on the hourly chart, similar to the overextension seen on the daily chart. For the next trading day, the hourly chart's pivot point is at $159.22, the resistance level is at $159.58, and the support level is at $158.59. The closing price was slightly below this pivot point but still above the first support level.
15-minute chart: Reference at the execution level
On a 15-minute period, the same bullish pattern reappears: the price is above the 20-period EMA of $157.79, above the 50-period EMA of $155.28, and also above the 200-period EMA of $152.18. The 15-minute RSI14 level is $66.06. However, the MACD line at 1.43 is slightly below the signal line at 1.54, with a bar chart showing -0.11. This slight negative value corresponds to a divergence from the daily chart, indicating that momentum may pause briefly on shorter time frames, but the overall trend remains bullish. The pivot point for the 15-minute period is consistent with the hourly chart, at $159.22, with resistance at $159.58 and support at $158.59. These levels can serve as references for entry points near the opening on Monday.
Bullish scenario
If the price can first break through the hourly line and the 15-minute pivot point of $159.22, then continue to surpass the resistance level of $159.58, and further advance towards the daily resistance level of $162.75, then the bullish scenario will be strengthened. If the daily MACD bar chart returns above the zero axis, and both the daily and hourly RSI14 indicators remain within the range of not being overbought, it will support the continuation of the trend rather than a short-lived surge followed by exhaustion. If the closing price consistently stays above the upper band of the daily Bollinger Bands at $157.11, it will also reinforce that this breakout is likely to be followed by further movement, rather than just a one-day spike.
Short Position Risk
On the contrary, the downside risk lies in the inability to hold the support level of $158.59 on the hourly and 15-minute timeframes. Once this level is broken and there is a pullback to around the daily pivot point of $156.05, it would indicate that the extension seen on Friday might have been excessive. If the closing price returns below the daily Bollinger Bands, specifically below $157.11, it will significantly weaken the rationale for the breakout. If the daily MACD bar chart continues to show weakness, this risk will increase. In such a scenario, the 20-day EMA support at $148.96 and the 50-day EMA support at $146.35 will become the next levels of support that need to be monitored.
News Background
At the same time, recent reports have provided some background information, but they have not changed the technical analysis. A report published by Investing.com during trading on Friday mentioned that the stock experienced a gain of about 6% during the session, but aside from the issue itself, no specific catalytic factors were explained. Another article by Seeking Alpha before the market opened on Friday viewed the reusability of Starship as a potential driving factor for orbital data centers. Two days prior, another article suggested that the progress of Starship's orbital launches might increase the production capacity of Starlink V3 and maintained a bullish outlook. On the same day, an article by Yahoo Finance cited a fund letter stating that SpaceX was benefiting from strong growth and expanding demand. Three days before that trading day, another report by Yahoo Finance mentioned that comments on Musk on X warned that Delta might lose customers due to Starlink controversies, while also noting that more than 600 aircraft had already accessed the relevant services provided by United. None of this content directly explains the reasons for the stock price fluctuations on Friday; therefore, it should be considered background information rather than an explanation for this rise.
Closing Market Observation
Overall, as of the next trading day, the Space Exploration Technologies stock remains above the upper band of the daily Bollinger Bands at $157.11 and slightly below the hourly pivot point of $159.22. The average daily true range of ATR14 is $6.83, indicating a relatively high level of volatility. The arrangement of EMA on the hourly and 15-minute charts confirms a bullish trend. However, both the daily and 15-minute MACD bar charts show a slight cooling in momentum. Whether this extension on Friday will continue to push towards the daily resistance level of $162.75 or whether it will fall back to test the range between $158.59 and $156.05 remains to be seen on the next trading day.
Frequently Asked Questions
What key price levels should be watched on the next trading day for SPCX?
The daily pivot point is at $156.05, with the first resistance level at $162.75 and the first support level at $152.25. On the hourly and 15-minute charts, the pivot point is at $159.22, the resistance level at $159.58, and the support level at $158.59. The closing price was slightly below the hourly pivot point but still managed to hold the first support level.
SPCX Can the breakout above the daily Bollinger Bands upper band be sustained?
This breakthrough has been confirmed, but it is still in an extended state. If the closing price remains above the daily upper line of $157.11, it indicates that there will be further follow-up gains; if the closing price falls back below that level, it will weaken the logic of the breakthrough. The daily RSI14 level is 61.48, which still provides room for growth, but the daily MACD bar chart at -0.03 seems a bit cautious.
What does a negative daily MACD bar chart mean for SPCX?
On the daily chart, the MACD line at 2.62 is slightly below the signal line at 2.65, resulting in a bar chart showing a difference of -0.03. This indicates that although the price has broken through, the daily momentum has only weakened slightly, which is more likely a divergence that requires observation rather than a clear reversal signal. In contrast, on the hourly chart, the MACD bar chart shows a difference of 0.79.
This article was generated with the assistance of artificial intelligence and has been reviewed by an editorial team.