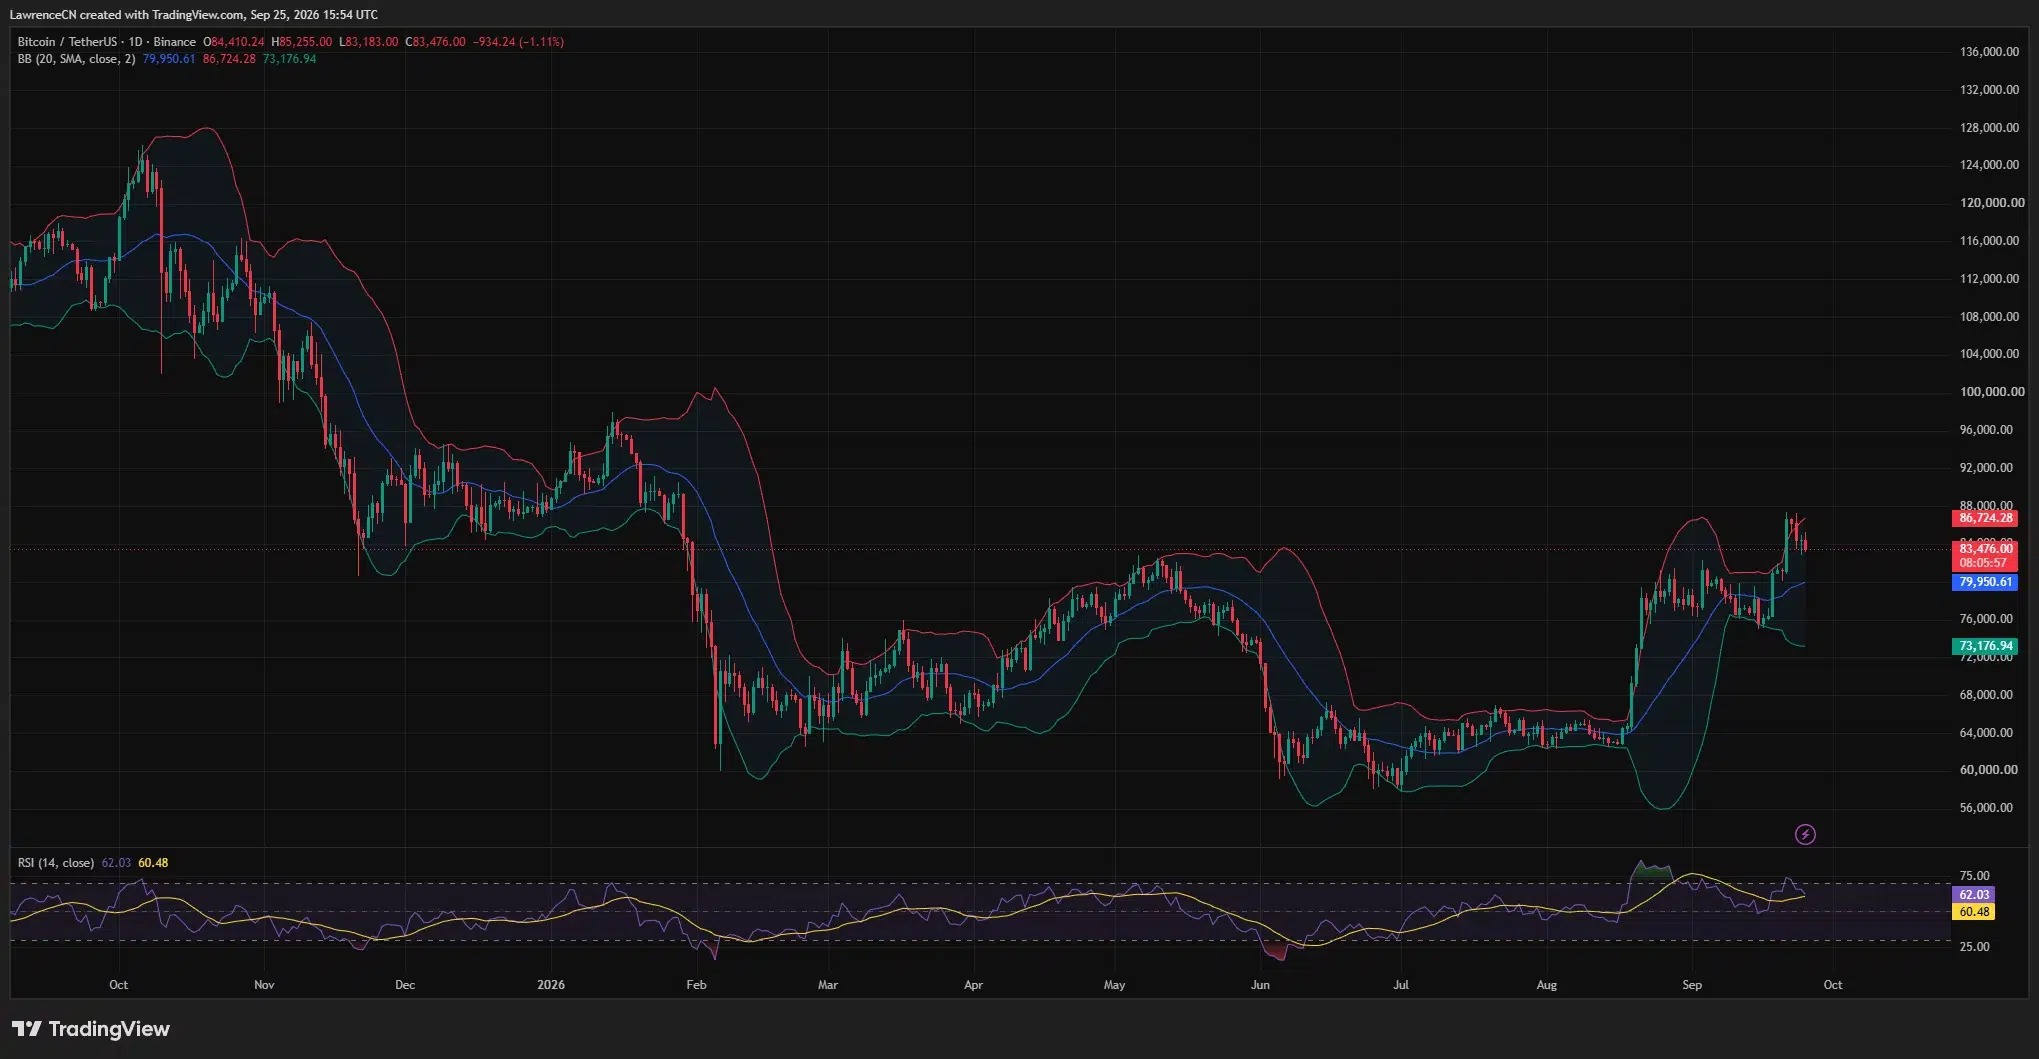


After hitting $87,220, the price of Bitcoin fell back to around $84,000. According to Bitfinex analysts, to continue rising further, there needs to be sustained buying above $86,500.
According to the data from Bitfinex, there are 1.39 million Bitcoins within the purchase cost range of $84,000 to $86,500. The US Bitcoin ETF attracted $170.2 million in capital inflows on October 1st, reversing the outflows from the previous trading day.
Bitfinex indicates that if the price falls below $81,300, and at the same time ETF continues to show capital outflows, the market structure will weaken.
The analyst team at Bitfinex stated in their comments provided directly to crypto.news that the re-emergence of net inflows into US spot Bitcoin ETF has pushed its demand indicators close to a level associated with continuous price increases. However, they still hope that buying interest will continue, as the large number of shares purchased between $84,000 and $86,500 remains central to their judgment.
On the Binance TradingView daily chart captured a bit later on October 2nd, Bitcoin was at $84,038, with a peak of $87,220 during the session. The chart shows that the daily decline was 0.99%, and the price returned to near the bottom of the buying range indicated by analysts.
Bitcoin needs to maintain continuous buying pressure above $86,500.
According to the data from this team, as of September 30th, the cost basis for approximately 1.39 million bitcoins was between $84,000 and $86,500. Bitfinex describes this concentrated range as the upper supply, as the purchase prices of holders constitute an important test for new demand.
In the view of analysts, if the price remains above $86,500, this supply will return to a profitable state, providing a clearer path for Bitcoin to reach its annual opening price of $87,722. They emphasize that the condition is that Bitcoin must remain above this range, rather than just briefly touching the upper limit.
"The question now is whether the spot demand can continue this trend," the team stated.
In a report on Bitcoin spot demand on September 30, analysts pointed out that the number of positions held within the range of $82,500 to $84,000 was 306,000 Bitcoins, which is higher than the approximately 110,000 Bitcoins held on September 27. They stated that the buying interest in this lower range reduced the number of shares held by investors waiting to sell near the break-even price.
U.S. ETF inflows have partially restored demand buffers.
In the US fund market, Bitfinex reported a net inflow of $170.2 million on October 1st, whereas on September 30th there was a net outflow of approximately $149 million. The re-emergence of buying interest caused the Bitfinex absorption/issuance ratio, namely BAER, to rise back to nearly five times the daily Bitcoin production volume.
This indicator is used to compare the buying orders of ETF with the newly mined Bitcoins. Analysts say that if the inflow remains near this level for the next few trading days, it will serve as support for a continued upward trend.
"We now hope to see that inflows close to this level can continue," said the analyst.
Prior to this reversal, the ratio for Bitfinex had dropped from a daily output of 25.6 times on September 21 to 1.8 times on September 29. The team stated that the net outflow of ETF on the following day resulted in a negative reading for that day.
In addition to the slowdown in fund buying, analysts also noted that as of September 29th, the number of open futures contracts had significantly decreased, leading to a reduction in market leverage. In their assessment on September 30th, they warned that deleveraging could reduce the risk of forced liquidations, but it would not generate the new buying demand necessary to drive prices up.
In an earlier report on ETF buying orders and leverage released on September 24, $999 million flowed into US Bitcoin ETF on September 21, and $714.7 million flowed in on September 22. BTCS S. A strategy advisor Wojciech Kaszycki stated that cash buying orders had already supported the beginning of this upward trend before the accumulation of borrowed positions.
In that judgment, Kaszycki tends to observe the inflow of ETF over several weeks and compares it with price changes in futures positions. He warns that if traders leverage up faster than cash buyers enter the market, the risk may increase.
The daily chart shows that the price is around $84,012.
On the TradingView daily chart, the price of Bitcoin at $84,038 almost precisely falls on the 0.618 Fibonacci level of $84,012.25. This retracement range is based on the higher high of $126,294.44 and the lower low of $57,876.66 above it.
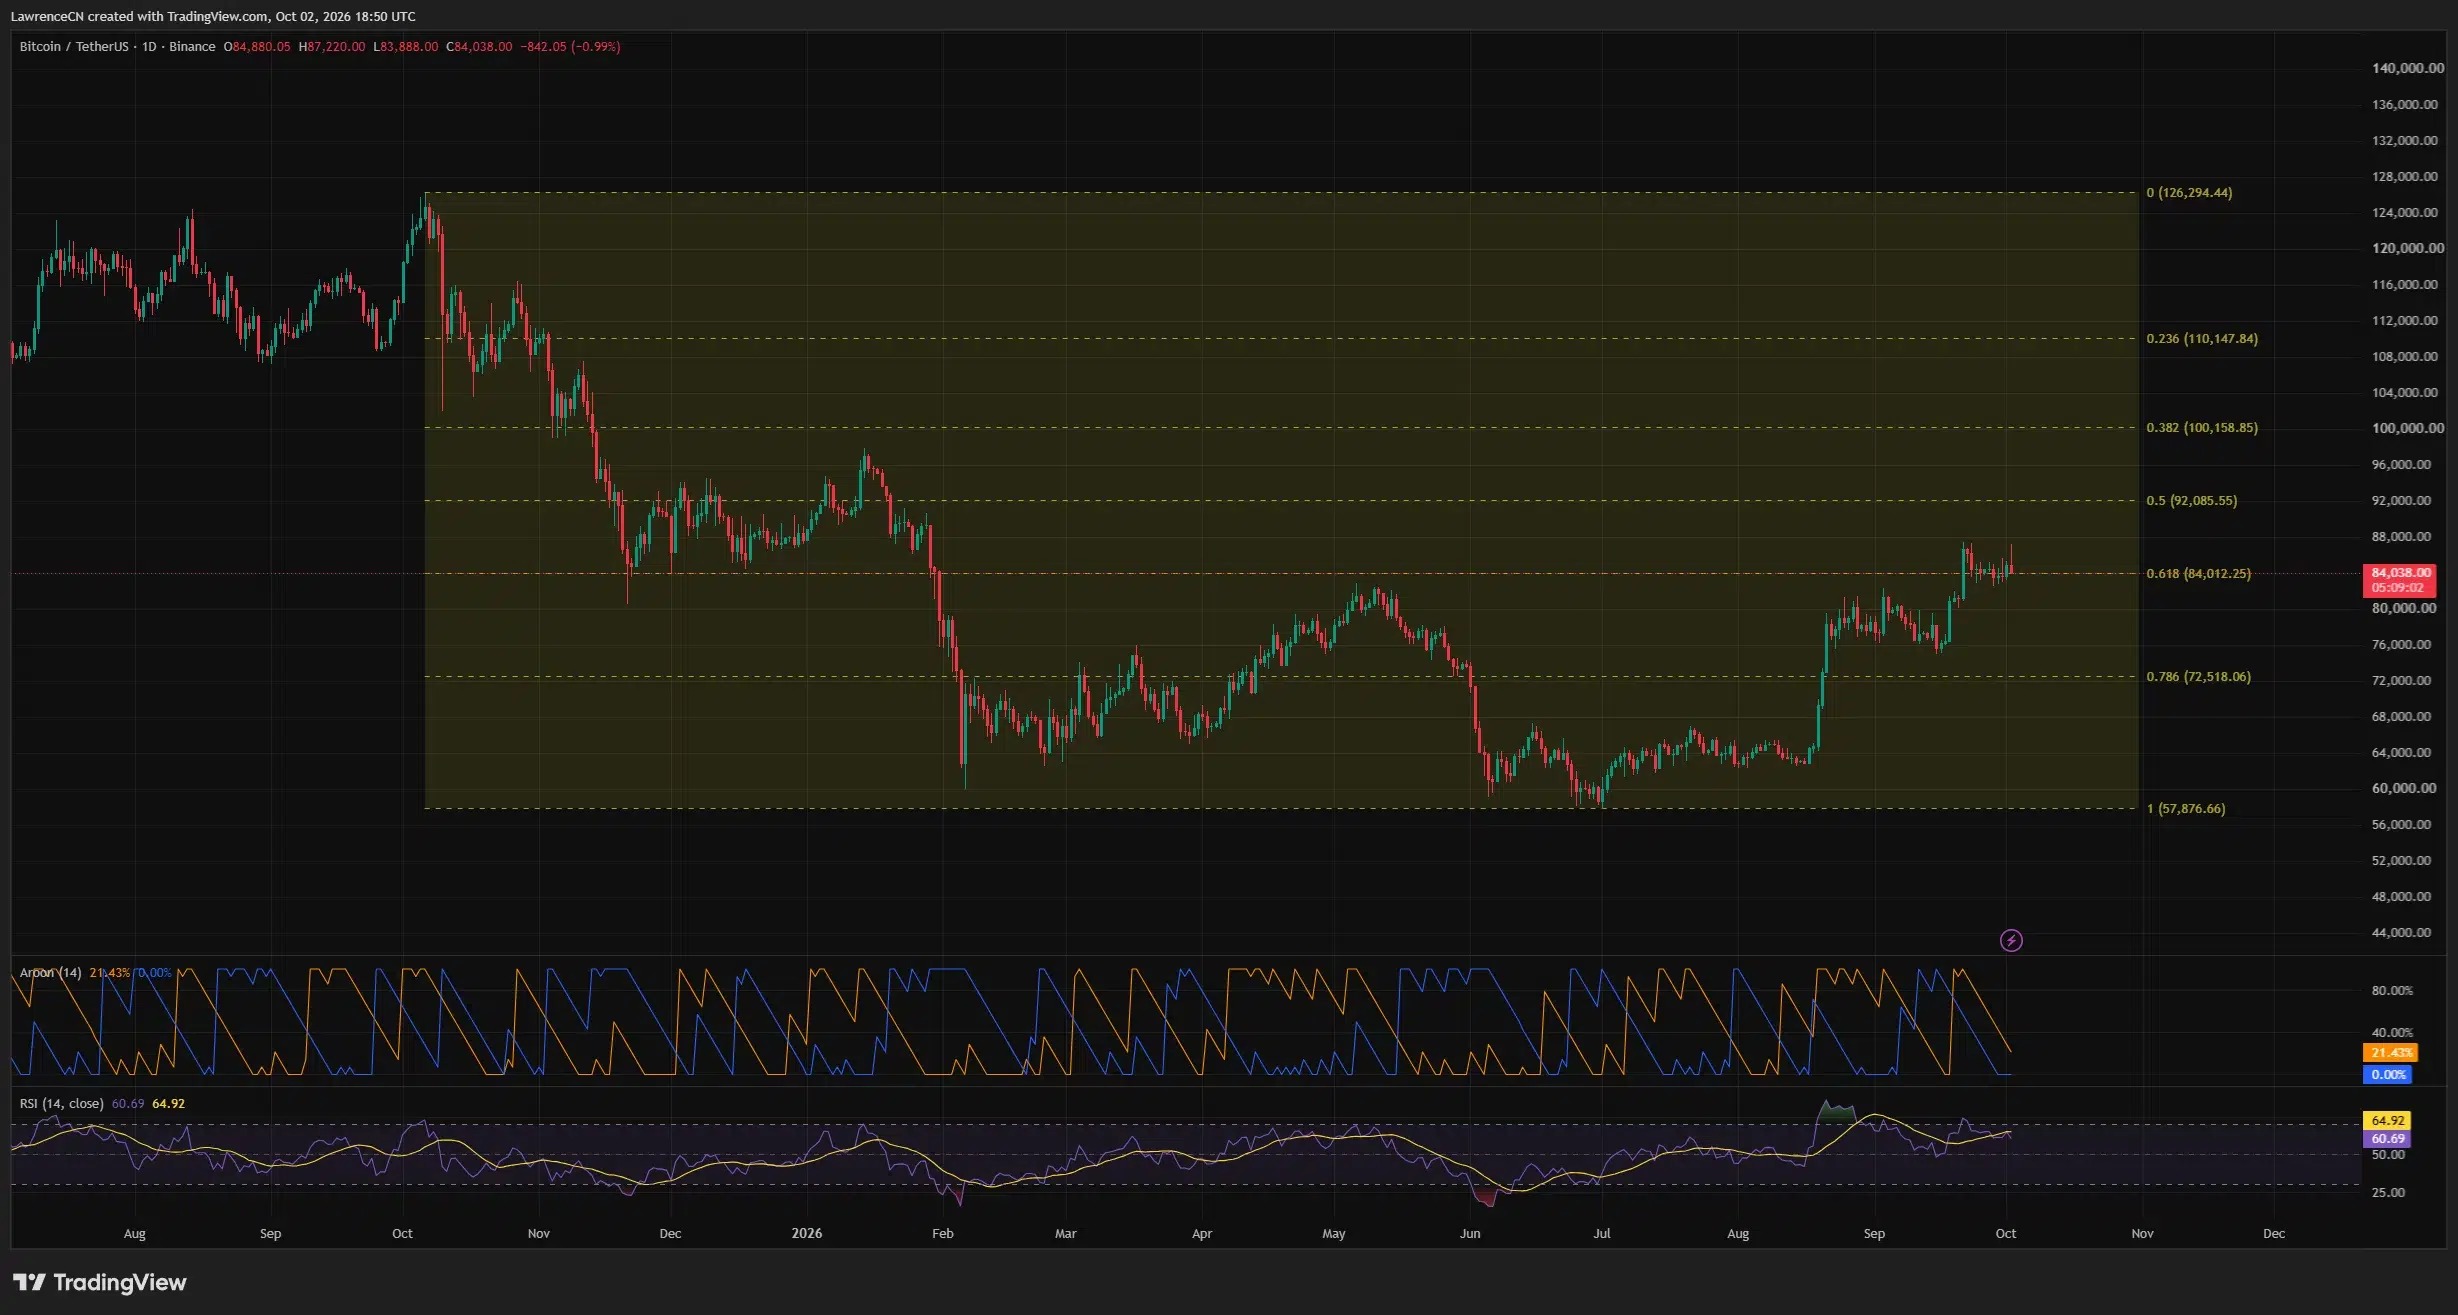
Above the price, the same chart shows that the 50% retracement level is $92,085.55, and the 38.2% retracement level is $100,158.85. Below that is the 78.6% retracement level at $72,518.06. These are the retracement levels plotted on the chart, and they are not the price targets provided by Bitfinex.
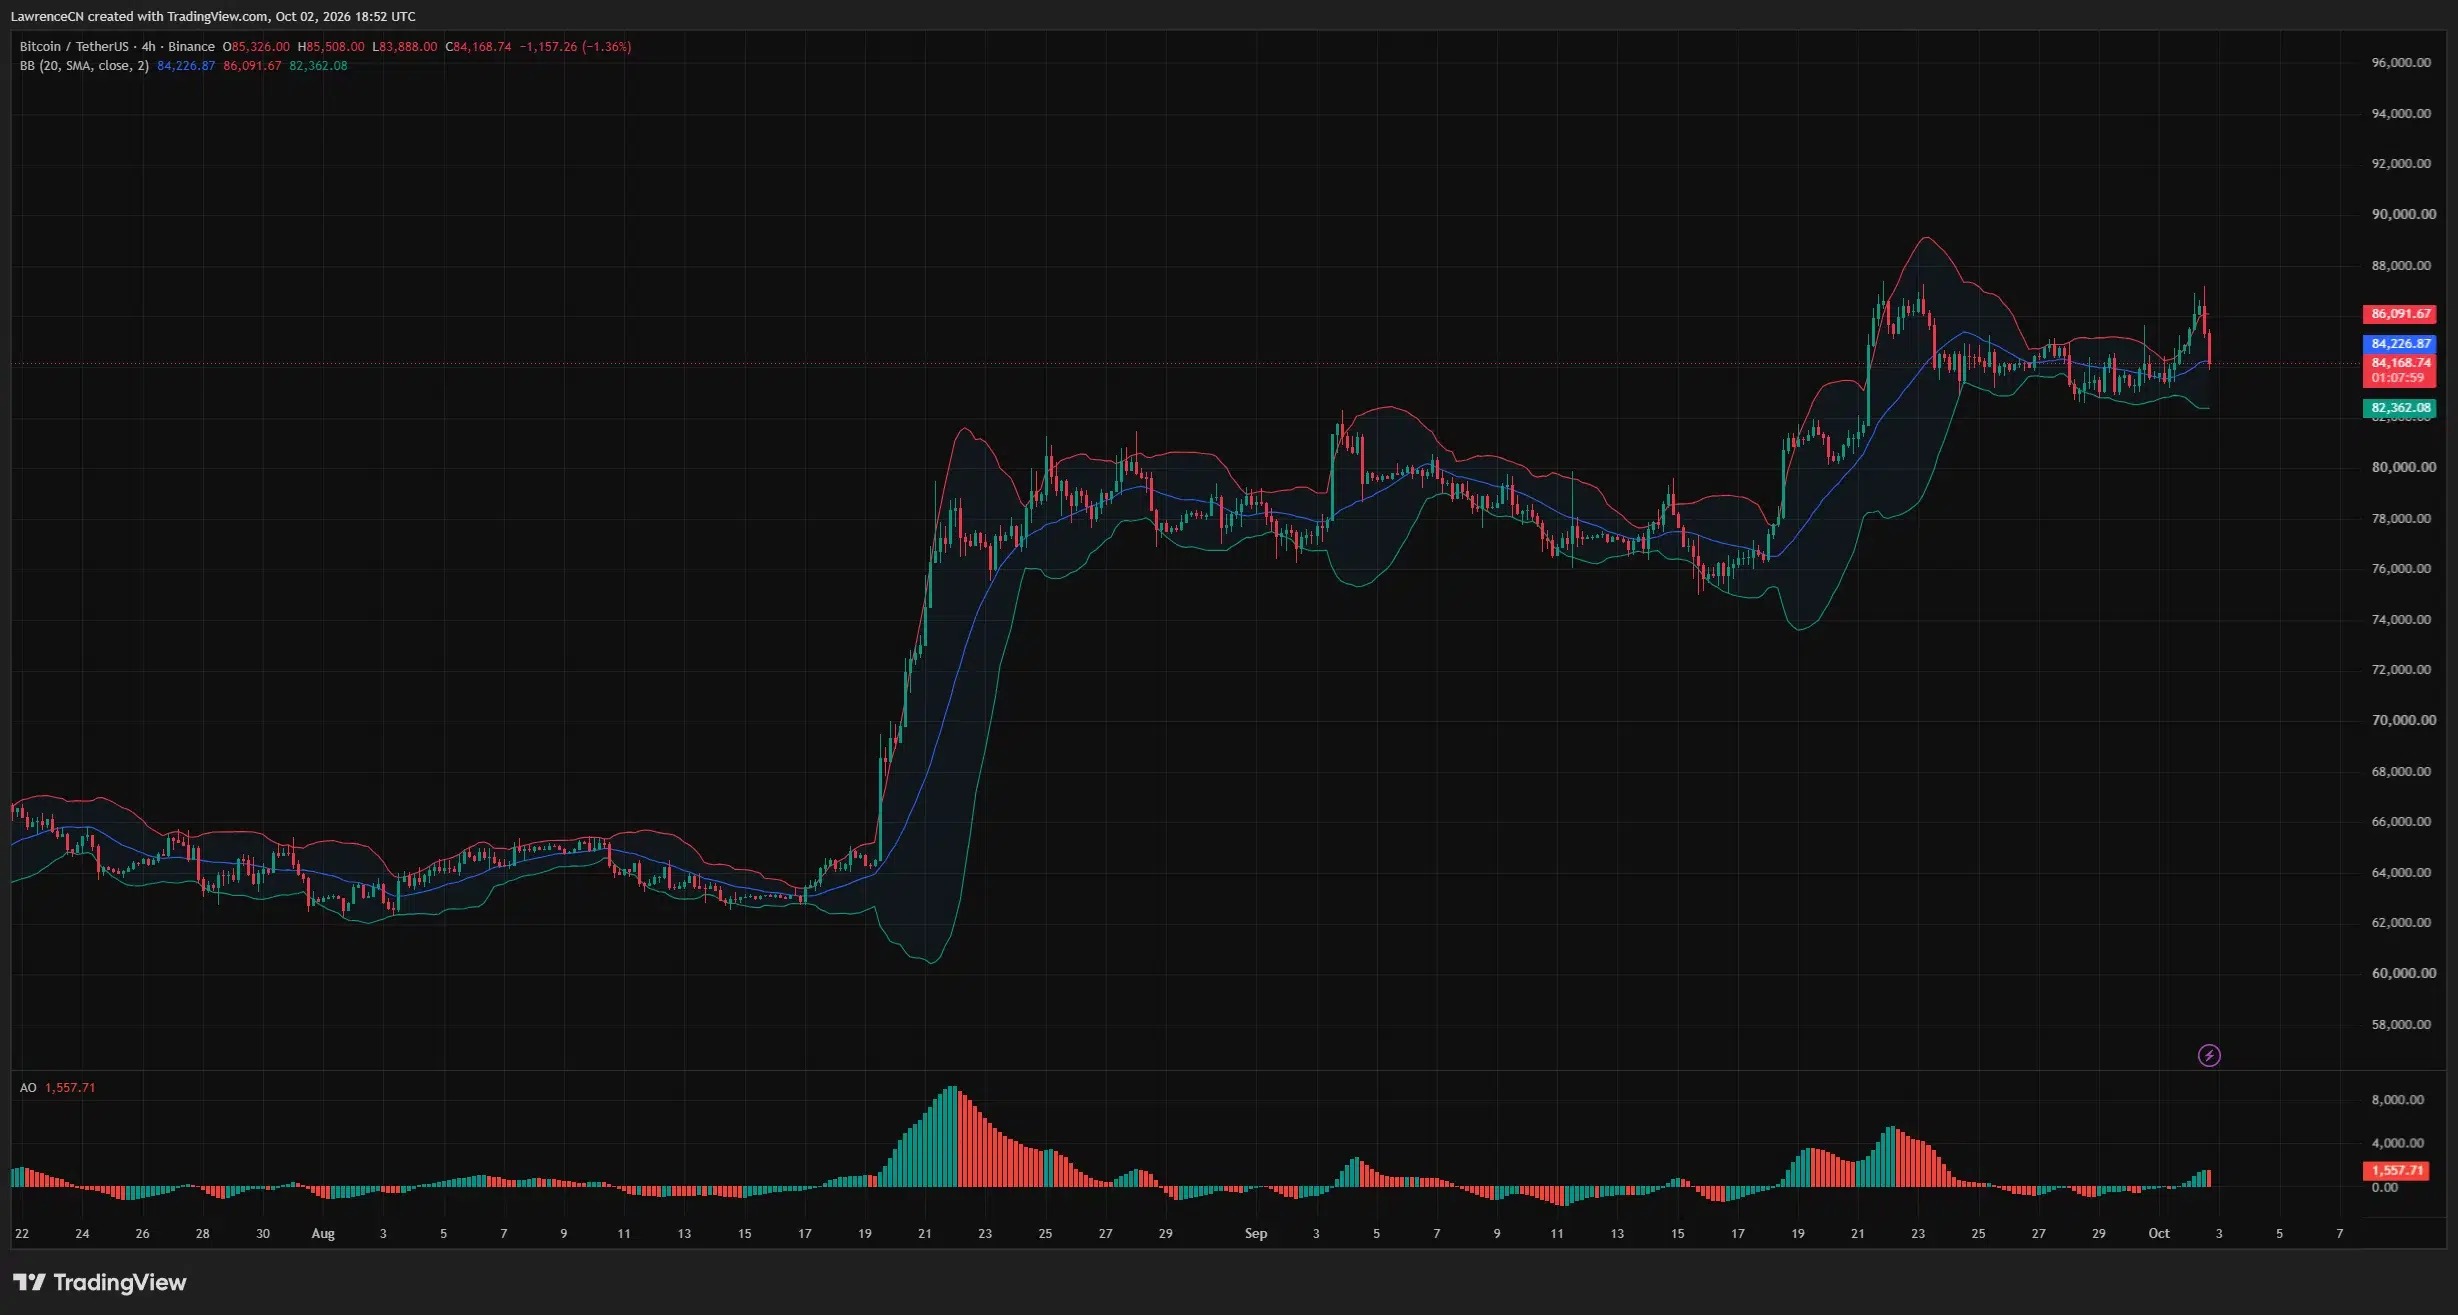
On another 4-hour chart, Bitcoin was at $84,168.74, slightly below the middle band of the Bollinger Bands at $84,226.87. The upper band is at $86,091.67, and the lower band is at $82,362.08.
Weaker U.S. data makes Treasury yields a focal point of attention
In a report on October 2nd regarding employment-driven Bitcoin gains, the U.S. non-farm payroll growth in September was 29,000 jobs, lower than the economists' expectation of 90,000 jobs. The unemployment rate rose from 4.1% to 4.2%, and the non-farm payroll increase in August was also revised down from 162,000 jobs to 133,000 jobs.
The report also states that when the price of Bitcoin approached $87,000, there were over $120 million in Bitcoin short positions closed within 24 hours. The report links this round of increase to weak employment data and the forced closure of short positions.
In the comments they provided, analyst Bitfinex also stated separately that the more moderate PCE inflation figures are a positive sign for the Fed's policy prospects, but these inflation data are not yet sufficient to alleviate the overall macroeconomic environment.
When referring to the event on September 23rd, the team mentioned that the rise in Bitcoin was mainly due to investment inflows, while the yield on U.S. Treasury bonds remained relatively stable. They warned that if yields start to rise again, interest rates could once more become the main driving factor in the market.
Analysts say that higher yields on U.S. Treasury bonds will increase the returns on dollar assets, while a stronger dollar will further suppress risk appetite. The team noted that despite recent fluctuations in ETF capital flows, the latest rise in Bitcoin indicates that underlying demand still exists.
Disclosure: This article does not constitute investment advice. The content and materials on this page are for educational purposes only.