Western Digital's stock price tumbled significantly on Friday, erasing the gains from Thursday, and fell below multiple daily support levels during the session. At 09:43 Eastern Time, the stock was trading at $419.84, a decrease of 9.24% from Thursday's closing price of $462.56.
Key Points
- As of 09:43 Eastern Time, Western Digital's stock price was reported at $419.84, a decrease of 9.24% from the closing price of $462.56 on Thursday.
- The price has fallen below the daily support level of $447.22 and the daily pivot point of $455.39 for S1.
- The hourly chart shows that the moving averages are completely bearish, with the stock price below the 20-hour, 50-hour, and 200-hour moving averages.
- The daily chart RSI14 is at 40.14, still above the oversold area; the hourly chart RSI14 is at 29.78, close to oversold.
- The bearish path points to the lower band of the daily Bollinger Bands at $409.72, as well as the 200-day moving average at $391.04.
This round of decline occurred following some more positive reports earlier this week. On Thursday, Western Digital closed at $462.56, up 1.78% from the previous trading day, according to a report from Yahoo Finance UK. Another article from Seeking Alpha titled Steven Cress also boosted market sentiment, highlighting improvements in the company's valuation and ratings, as well as top-tier quantitative ratings related to demand for artificial intelligence storage; another article from Seeking Alpha provided detailed information on how WD Red Pro HDD is positioned to support NAS systems driven by AI. A report from Yahoo Finance mentioned that Zacks.com users have been closely watching this stock, while another article from Yahoo Finance compared Western Digital to other AI infrastructure companies, considering them potential beneficiaries of rising bond yields and the shift of capital towards physical asset businesses with stronger cash-generating capabilities. However, none of these reports directly explained the sharp decline on Friday.
Western Digital stock price: Daily chart structure weakening

Trend moving averages indicate weakening in the short term.
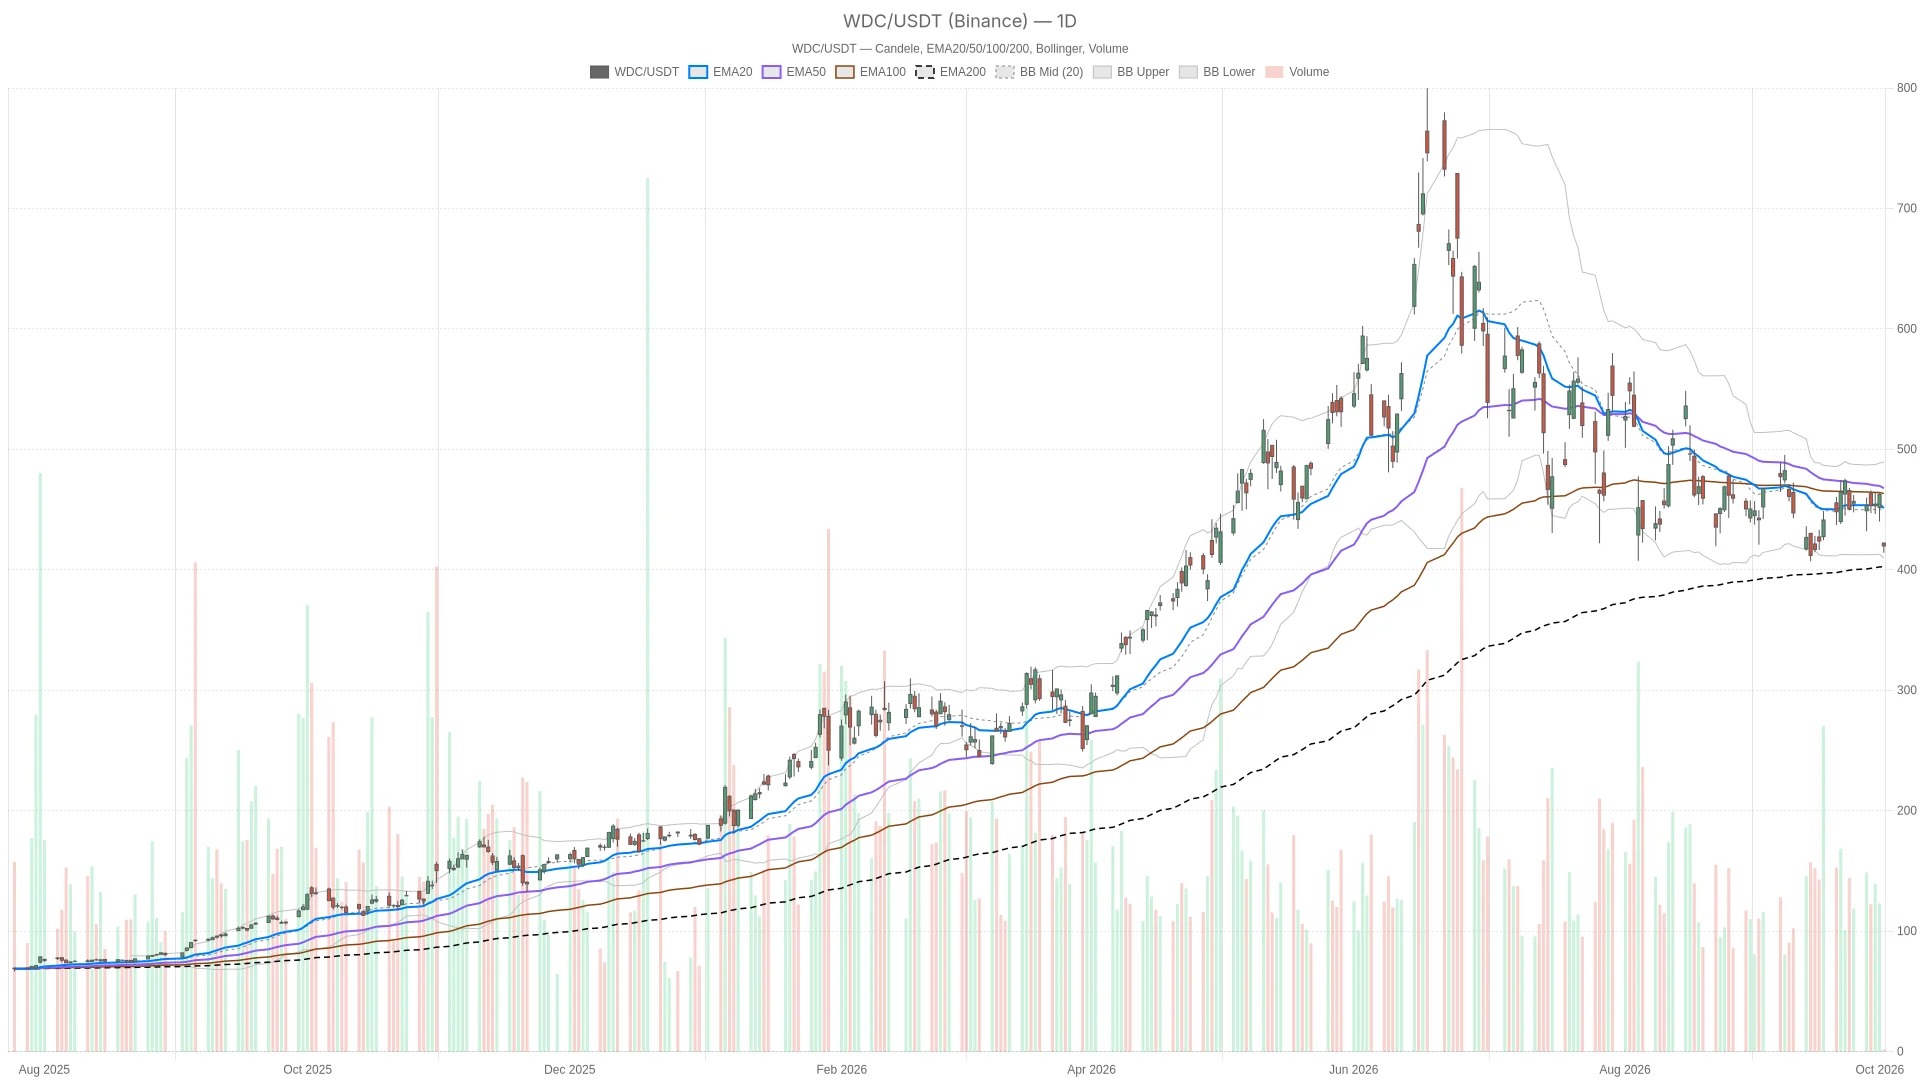
From the daily chart perspective, Western Digital's stock price is below the 20-day EMA of $451.23 and the 50-day EMA of $467.75, while it is still above the 200-day EMA of $391.04. This indicates a neutral position: the short-term and medium-term trends have weakened, but the longer-term daily structure has not yet fallen below the long-term moving average.
The momentum indicator shows that conditions are deteriorating.
The daily line RSI14 shows a value of 40.14, which is below the neutral 50-line, but it has not yet entered the oversold area; momentum is merely weak rather than exhausted. The daily line MACD is at -5.81, which is higher than the signal line of -6.71, and the bar chart indicates a value of 0.9. Both figures are still below the zero axis, so the broader daily trend remains negative. It is worth noting that the MACD line is above the signal line, indicating that at least for now, the selling pressure has slowed down.
Support level lost
The stock price is currently trading between the middle band of 449.67 USD and the lower band of 409.72 USD of the daily Bollinger Bands, and it is closer to the lower band. The daily ATR14 indicator is at 27.73, indicating a larger average range of fluctuations and higher volatility. On Friday, the price clearly fell below the daily S1 support level of 447.22 USD, and it is also significantly lower than the pivot point of 455.39 USD. This is a meaningful technical break below support, rather than a minor pullback.
Hourly chart momentum confirms a bearish trend.
The hourly chart is almost self-explanatory. The price is below the 20-hour EMA at 451.12 dollars, and this moving average is also below the 50-hour EMA at 451.72 dollars, which in turn is below the 200-hour EMA at 455.88 dollars. This is a clear bearish setup, with the price situated below all moving averages, and the moving averages are all trending downwards.
The hourly chart RSI14 has dropped to 29.78, approaching oversold territory. The hourly chart MACD line is at -2.27, below the signal line of -0.36, and the bar chart shows -1.91, indicating a negative trend. Downward momentum still exists, and unlike the daily chart readings, there are no signs of an early slowdown yet. The price has also fallen below the lower band of the hourly Bollinger Bands at 434.27 dollars. Meanwhile, the hourly pivot point of 460.84 dollars and the support level S1 of 458.12 dollars are both significantly higher than the current price.
This is also where the divergence between the daily and hourly charts lies. Although the daily chart structure has fallen below S1, the overall trend still carries a neutral tone, with prices remaining above the 200-day moving average; in contrast, the hourly chart clearly indicates a bearish trend. The moving averages are arranged in a downward direction, and momentum is not stable but continues to accelerate. In actual trading, the weakness observed in the hourly chart has confirmed and exacerbated the deterioration of the daily chart.
15-minute chart: Used for observing execution points
On the 15-minute chart, which is used solely for timing analysis, RSI14 is at 24.09, clearly indicating an oversold condition. The MACD line is at -1.26, which is 0.11 below the signal line, and the bar chart shows -1.37. The price is also below the lower band of the 15-minute Bollinger Bands at $433.5 and far below the 15-minute S1 support level of $460.66. Therefore, the short-term oversold reading increases the likelihood of a rebound or consolidation, but it is not sufficient to reverse the current pressure dominated by the hourly and daily charts.
The bullish and bearish paths of Western Digital's stock price
For a bullish scenario to emerge, Western Digital's stock price needs to first regain support at the daily level of $447.22 ($BJWKEEP_00001__), and then recover to the daily pivot point of $455.39. If it can further rise above the 20-day moving average of $451.23 ($BJWKEEP_00002__), short-term pressure will also be alleviated. On the hourly chart, the price needs to return above the pivot point of $460.84; moreover, if it can also return above $50 ($BJWKEEP_00003__), it can be confirmed that buyers have regained control of the situation. Before these levels are re-established, any rebound is still likely to encounter new selling pressure.
What is more likely to happen at present is a bearish trend. If the price continues to decline, it may test the lower band of the daily Bollinger Bands at $409.72; further down, the 200-day moving average of $391.04 will become the next structural reference point. On the hourly chart, as long as the negative candlesticks continue to appear, sellers will still have the upper hand. If the price remains below the lower band of the Bollinger Bands at $434.27, this control will be strengthened. Only by regaining the aforementioned levels will this bearish continuation scenario be negated.
Overall, as of 09:43 Eastern Time, Western Digital's stock price was at $419.84, a decrease of 9.24% from Thursday's closing price of $462.56. The price has fallen below all significant daily and hourly support levels, including the daily pivot point of $455.39, the S1 support level of $447.22, and the hourly chart pivot point of $460.84. The daily ATR14 is at 27.73, reflecting a true and wide trading range. What remains uncertain at this time is whether this is just a short-term sharp decline that has gone too far. The oversold readings on the 15-minute and hourly charts support this interpretation; however, it could also be the beginning of a deeper pullback, ultimately testing the 200-day moving average. For now, the charts cannot provide a clear answer.
Frequently Asked Questions
What is the current stock price of Western Data?
As of 09:43 Eastern Time on Friday, Western Digital's stock price was reported at $419.84, a decrease of 9.24% from Thursday's closing price of $462.56.
What key support levels need to be watched out for?
The daily support level of S1 at $447.22 and the daily pivot point of $455.39 have been breached. The next reference levels below are the lower band of the daily Bollinger Bands at $409.72 and the 200-day moving average at $391.04.
Is Western Digital in a state of overselling?
It depends on the time frame. The daily chart RSI14 shows a value of 40.14, which is not yet oversold; however, the hourly chart RSI14 shows 29.78, which is close to oversold, while the 15-minute chart RSI14 shows 24.09, which is clearly in the oversold zone.
What signals indicate a bullish reversal?
A bullish reversal requires the stock price to regain the daily support level of $447.22 and the daily pivot point of $455.39. On the hourly chart, if the price can return above the pivot point of $460.84 and RSI14 can rise back above 50, it can be confirmed that buyers have regained control of the situation.
This article was generated with the assistance of artificial intelligence and has been reviewed by an editorial team.