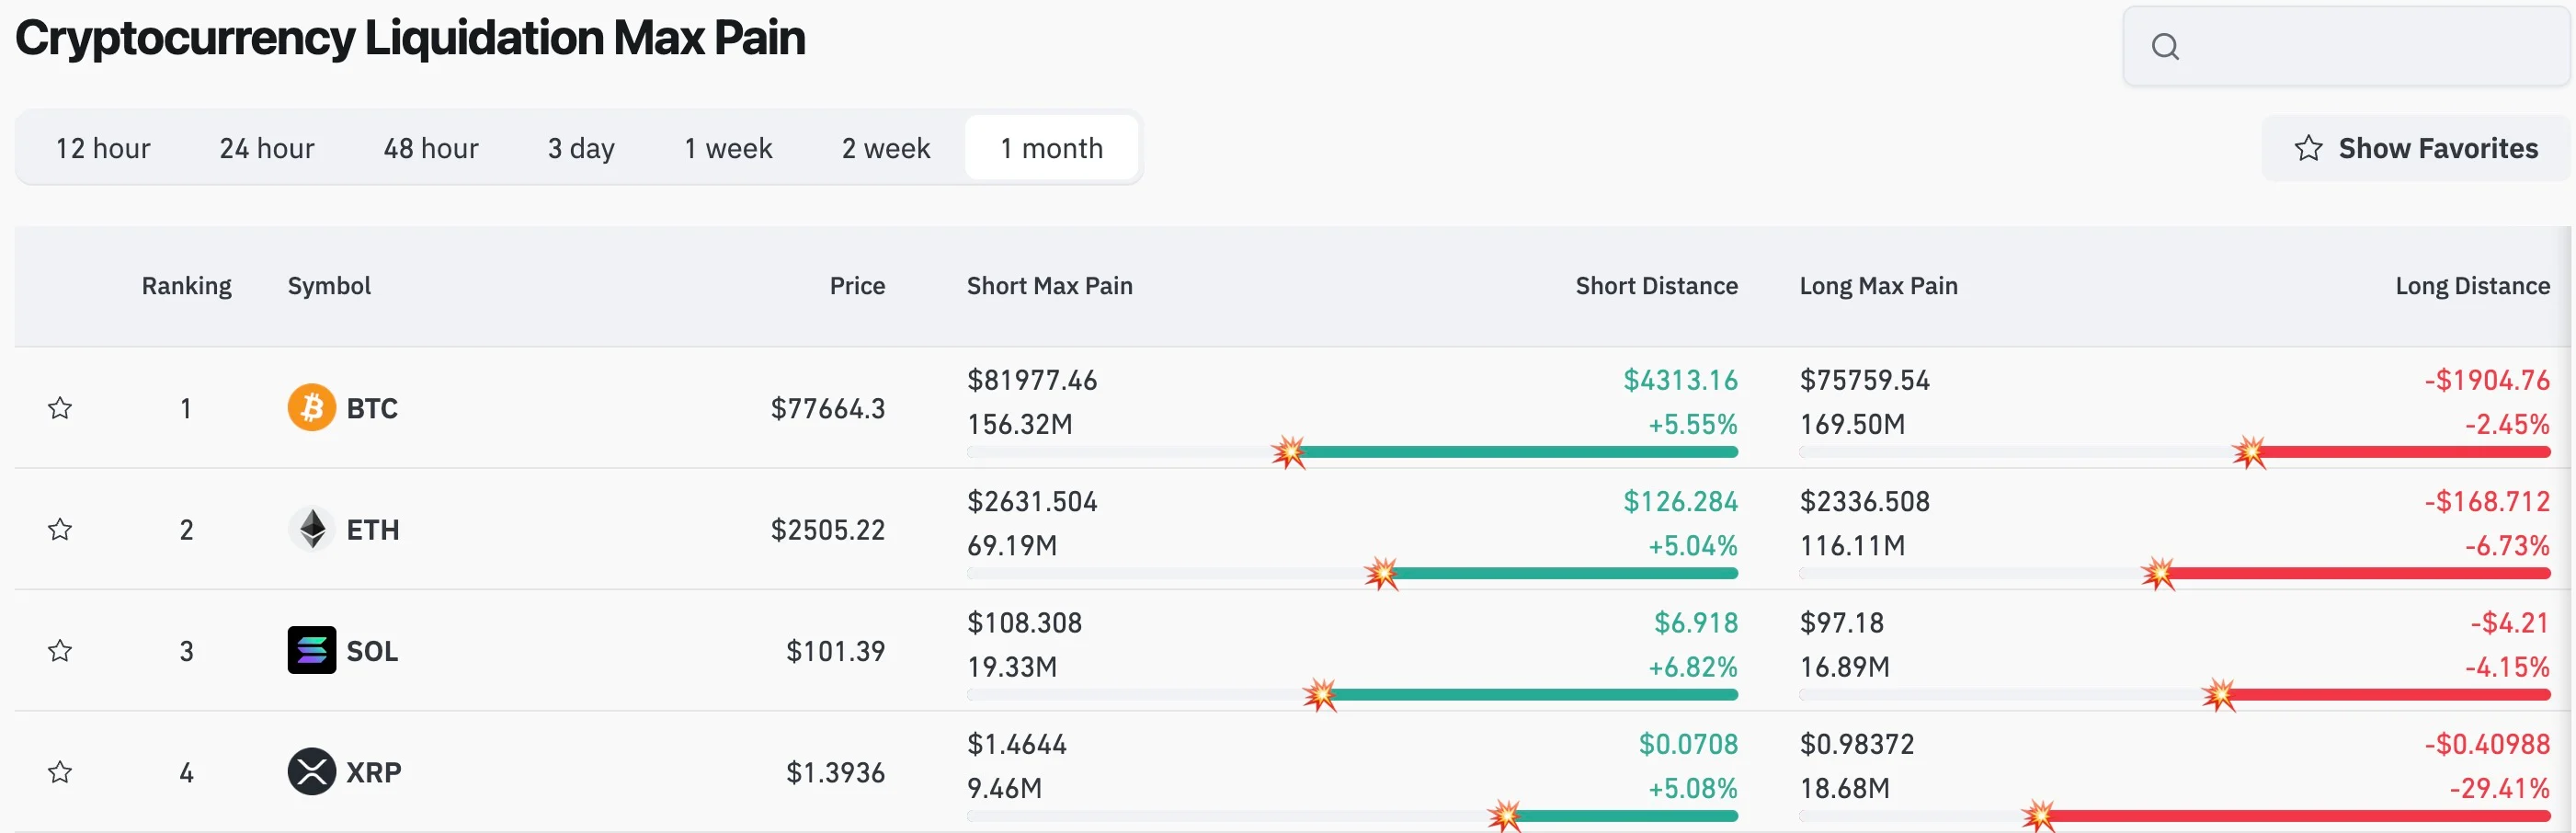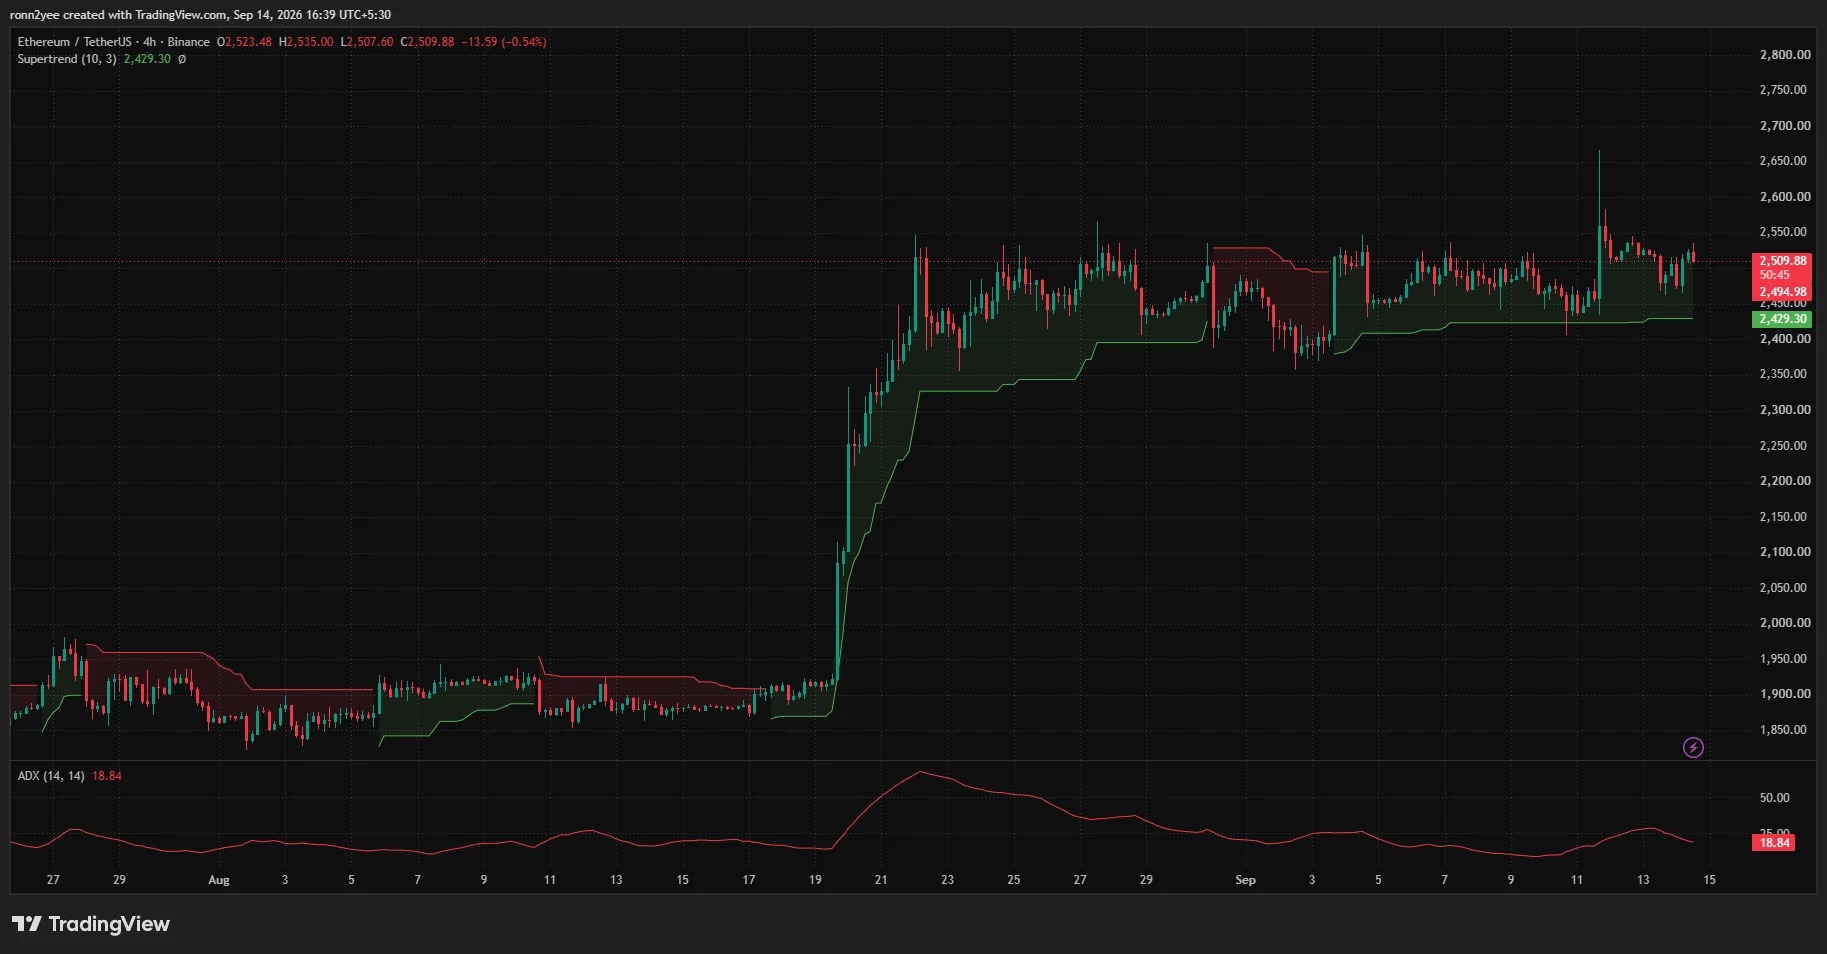






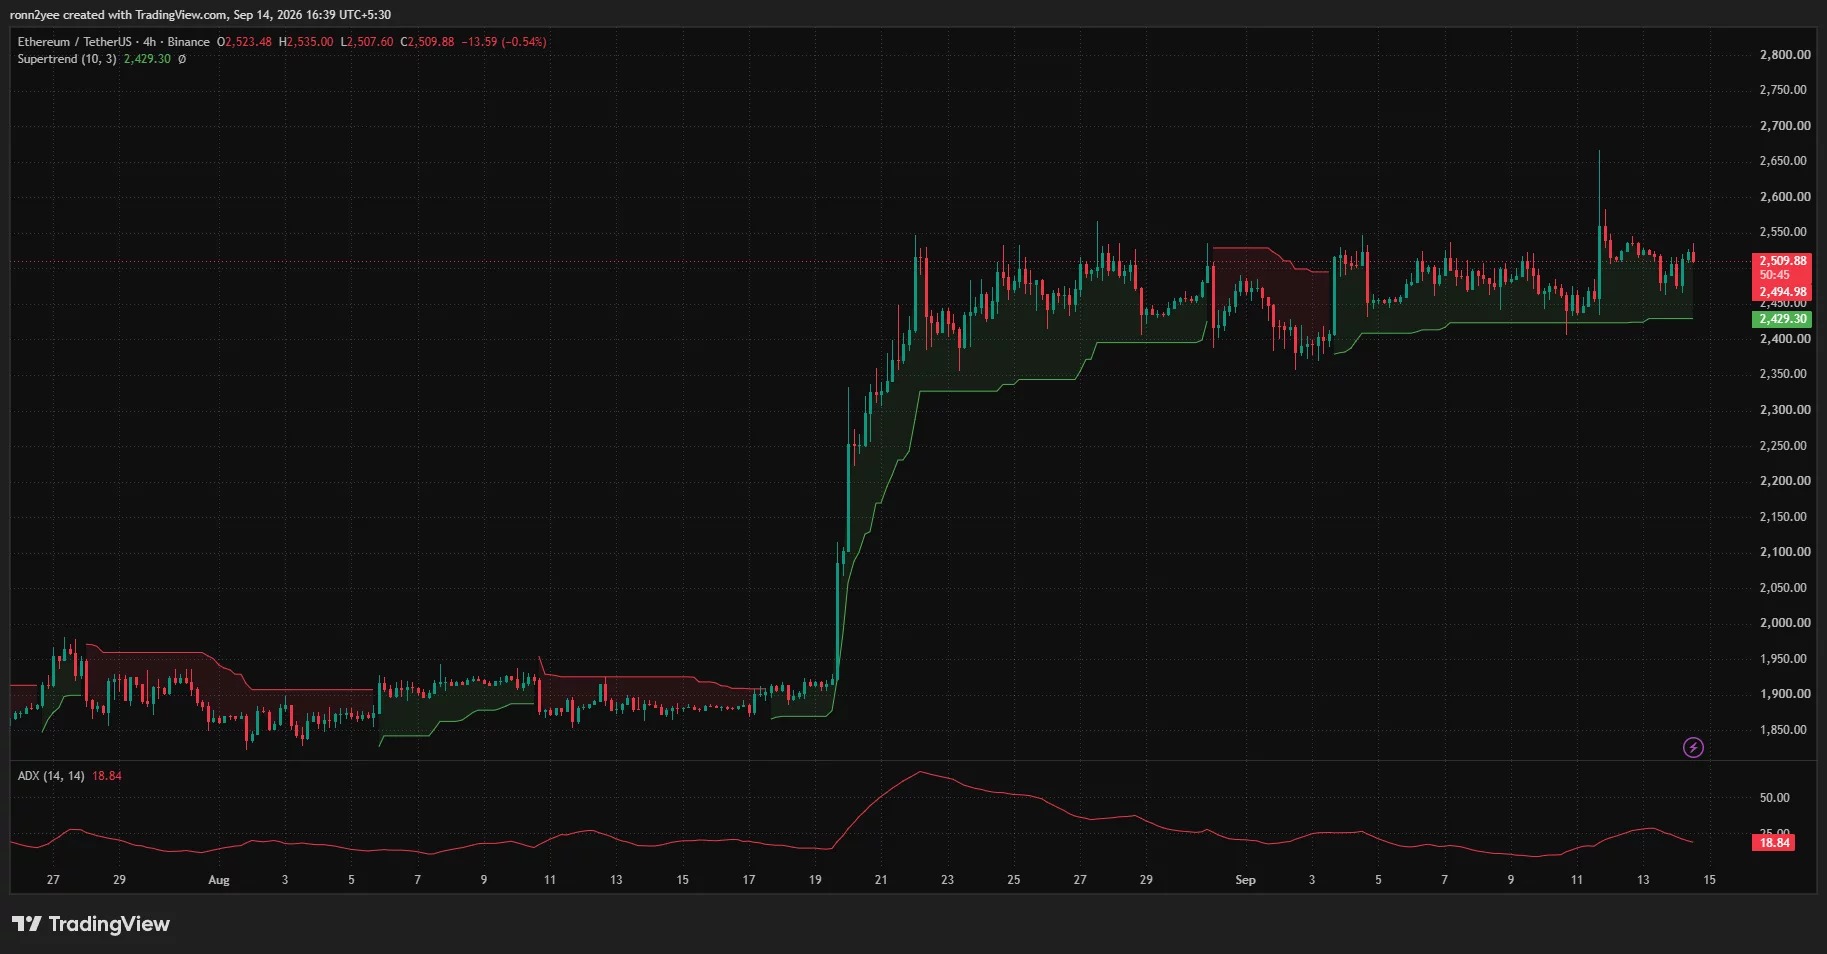
Ethereum remained in a range above $2,500 on September 14, reaching around $2,535 at one point during the session, but failed to hold above $2,550. The market is waiting for new directional signals, and short-term funds are behaving cautiously.
The price is still operating within the range.
On that day, ETH opened at around $2,477, hit a low of nearly $2,465 during the session, and then rebounded to the $2,510 range. Since the rebound at the end of August, Ethereum has mostly fluctuated within the $2,400 to $2,550 range, making several attempts to break through the upper limit only to fall back again, without yet forming a clear breakthrough.
On September 11th, ETH briefly broke through $2,550 and reached around $2,670, but then quickly returned to its previous range. This indicates that the upward pressure still exists, and the area around $2,550 continues to serve as a dividing line between bulls and bears in the short term.
The momentum indicator shows weak buying pressure.
From the perspective of moving averages, Ethereum is still above the main daily moving averages. The 20-day simple moving average is around $2474, which serves as the most recent level of dynamic support; the 50-day, 100-day, and 200-day moving averages are located near $2198, $1975, and $2061, respectively.
However, some momentum indicators have not strengthened simultaneously. The Average Directional Index ADX on the 4-hour chart has dropped to 18.84, which usually indicates a weaker trend, making it easier for prices to remain within a range of fluctuations. The Chaikin Money Flow on the daily chart is negative as well, indicating insufficient capital inflow.
This set of signals does not necessarily mean that the trend has turned bearish, but it indicates that for the price to break through $2,550, the market still needs more substantial volume support.
The Fed's vote and the Senate's deliberations draw attention
At a macro level, the U.S. market is awaiting the Federal Reserve's interest rate decision on September 16. The U.S. Bureau of Labor Statistics previously announced that consumer prices rose by 0.4% month-on-month and 3.4% year-on-year in August. The strong inflation data has heightened market expectations for further interest rate hikes, putting pressure on risk assets, including crypto assets.
Meanwhile, the capital flow of US spot Ethereum ETF continues to fluctuate. Farside Investors data shows that on September 9th there was a net inflow of 34.7 million US dollars, while on September 8th there was a net outflow of 24.3 million US dollars, which is basically consistent with the recent state of lack of a clear price direction.
On the policy front, traders are also paying attention to the progress of the Senate's deliberation on the crypto market structure bill in the United States. If the bill progresses smoothly, it may improve the regulatory expectations for local crypto businesses in the US and boost market sentiment.
In the short-term perspective, $2,550 remains a key resistance level that Ethereum needs to overcome again. Below that, the support around $2,474 is worth watching first, with a stronger support level at around $2,429. If prices fall below this area, the market might retest the range between $2,350 and $2,400.