

ADA continued its downward trend this week, falling below $0.168 after failing to break through the 50-day moving average. The market currently lacks a clear direction; on one hand, derivatives traders are divided in their opinions, while on the other hand, some large-scale holding addresses continue to buy.
The long-short ratio is biased towards the long side, and funding rates have turned negative.
CoinGlass data shows that the long/short ratio for ADA was 1.07 on Friday, indicating that among leveraged traders, bullish positions slightly outnumbered bearish positions.
However, another, more sensitive derivatives indicator is not so optimistic. The funding rate for ADA perpetual contracts turned negative on Thursday, reaching approximately -0.014 on Friday. A negative funding rate typically indicates rising bearish sentiment, with the market still betting on further declines.
Large addresses increased their holdings of 120 million ADA this week.
On-chain data shows that some large holders continued to increase their holdings during the price weakening period. Santiment data shows that since Monday this week, addresses holding 1 million to 10 million ADA and addresses holding 10 million to 100 million ADA have collectively increased their holdings by approximately 120 million ADA.
In contrast, addresses holding between 100,000 and 1 million ADA remained relatively unchanged, indicating that the recent buying activity primarily came from larger wallets. This selective buying suggests that some large investors are still positioning themselves for medium- to long-term investments.
Still under pressure from multiple moving averages
From a price structure perspective, ADA remains in a weak range, currently trading below the 50-day moving average of $0.176, the 100-day moving average of $0.202, and the 200-day moving average of $0.267. The continued resistance at these levels indicates that medium-term selling pressure has not yet eased significantly.
Momentum indicators also fail to provide a clear direction. The Relative Strength Index (RSI) is close to 48, indicating a roughly balanced buying and selling force. Although the MACD is still slightly above the zero line, bullish momentum is weak, and the rebound is unlikely to be sustained.
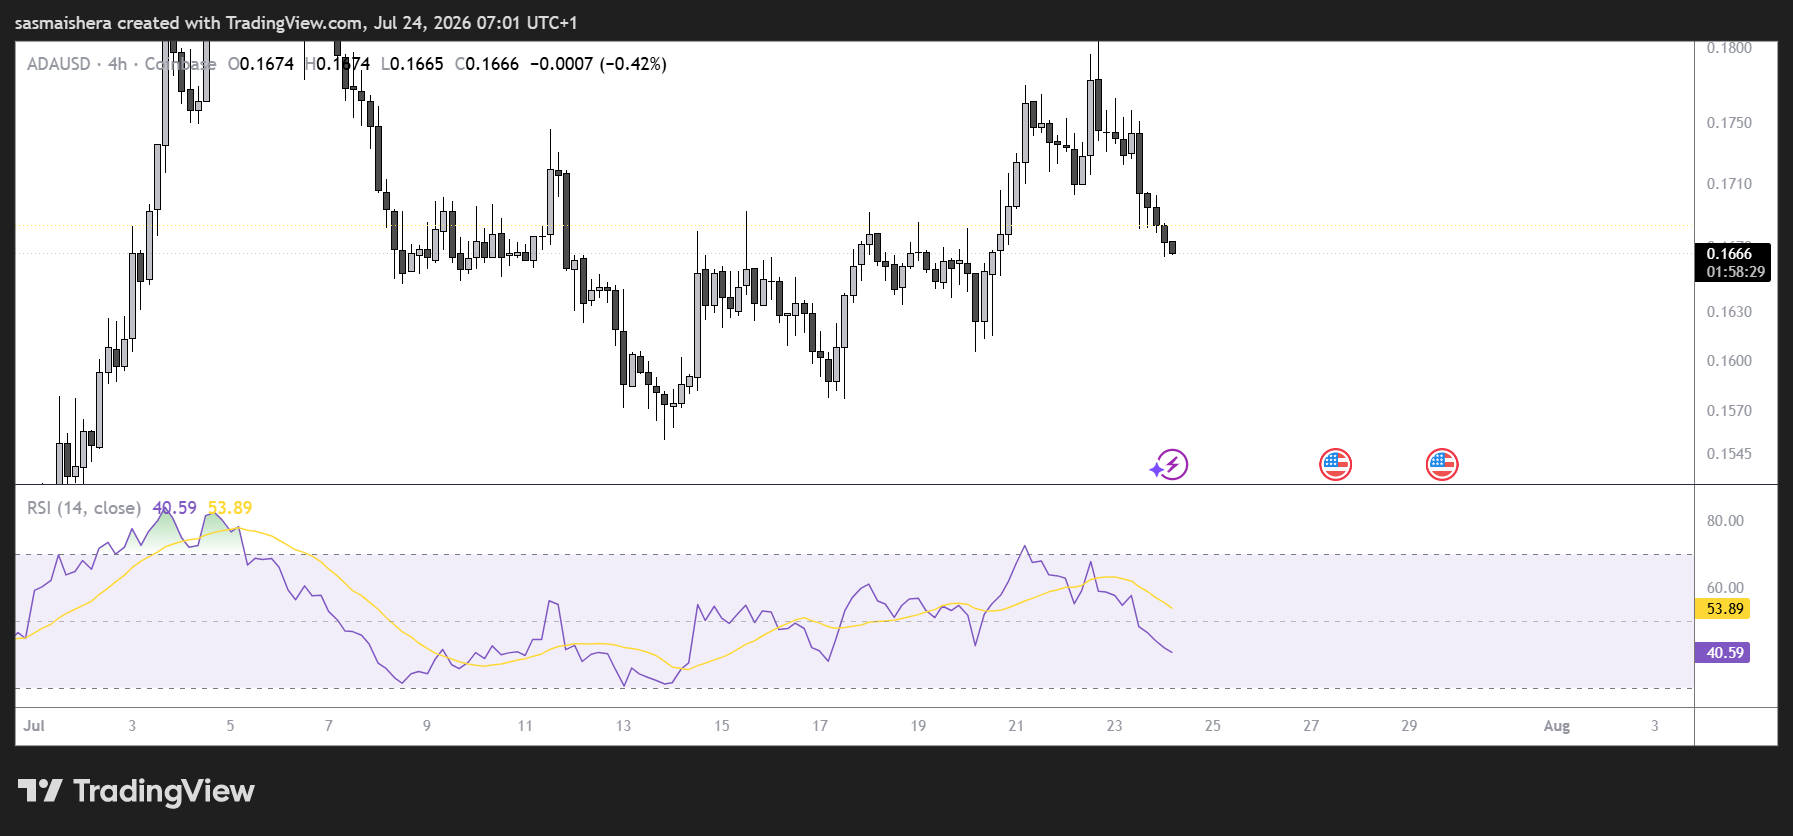
The previously broken long-term downtrend line has now become a new resistance level around $0.197. On the downside, the market is currently focused on the horizontal support at $0.150 and the key support level at $0.138.