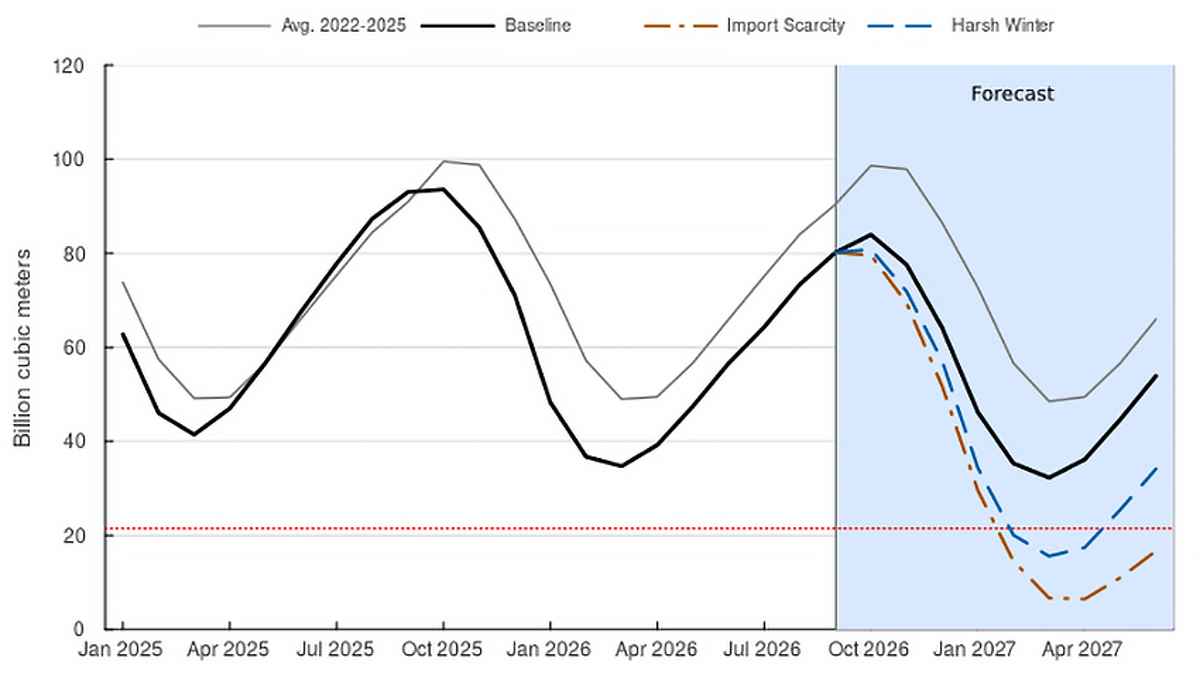














As of the end of September, natural gas storage facilities in the European Union were approximately 72% full, which represents the lowest level since 2011 when daily data for the entire EU became available. A study published by the Federal Reserve on November 20 estimated that if LNG imports decrease by one-third compared to last year, inventories could be down to just 6% of capacity by next April.
There are two sets of figures here. The initial gas storage rate is based on the daily data from GIE; the scenario inventory is defined by Eurostat and includes natural gas stored abroad, which is about 3 to 5 billion cubic meters higher than the underground inventory on the same day as recorded in GIE. Therefore, the percentages shown in the scenario diagram cannot be directly compared point-for-point with the daily gas storage rate.
Supply has not plummeted, yet the safety cushion has already thinned.
The study was written by Johannes Fleck and represents the author's views. As of September 30th, the EU's gas storage rate was 71.6%, which is 10.9 percentage points lower than the previous year, while Germany's rate was only 58.0%. These figures represent the stock levels before winter and cannot be mistaken for the inventory on November 20th.
The supply structure explains why there have been changes in vulnerability. The European Union's imports of natural gas from Russia decreased from 158 billion cubic meters in 2021 to 40 billion cubic meters in 2025, with the proportion of imports from outside the region falling from 44% to 13%. Norway became the largest supplier, while LNG's imports increased from 80 billion cubic meters to 146 billion cubic meters.
LNG refers to liquefied natural gas, which is used by ship to fill the gap created by the reduction in pipeline gas supplies. By 2025, it will account for 46% of the EU's imports, with about three-quarters of the new LNG coming from the United States. In the first seven months of 2026, the United States still supplied about half of the EU's LNG.
A fact that is easily overlooked is that in the first seven months of 2026, natural gas imports from outside the EU region were only 1% less than the previous year. LNG accounted for 45%, and there was no such significant collapse in imports as would be expected with low inventories. The problem is that the starting point was already low, and there is limited room for replenishment, while shiploads compete among different markets.
Research indicates that by 2025, Qatar will account for only about 9% of the EU’s LNG supply, and around 6% in the first seven months of 2026. The proportion of direct purchases is not high, so it is still not possible to isolate from global competition: Asian buyers who lose access to Qatar’s supply will turn to Atlantic shipments, and Europe will also have to compete for these resources. This is the indirect transmission path identified by the author.
Three inventory curves, the most risky one comes from imports.
The baseline scenario starts with a inventory of approximately 80 billion cubic meters at the end of September. It is assumed that production and imports in each month are equal to those of the same month last year, and consumption is equal to the average of the corresponding months in the past four winters. The inventory drops to about 84 billion cubic meters in October, and by the end of March 2027, it has reduced to 32 billion cubic meters, which is about 30% of the original capacity. After that, replenishment of the inventory begins.
In the severe winter scenario, supply is maintained at the same level, with monthly consumption adjusted to the highest levels of the past four winters. By the end of March, inventory had dropped to 16 billion cubic meters, which is about 15% of the total capacity, and it remained below 20% from February to April. The author does not assume that this scenario will necessarily occur; it is used to observe how higher heating demands will deplete the safety margin.
In the scenario of import shortages, the baseline consumption is still used, with each month's LNG imports reduced to two-thirds of the previous year's level. From October to March, the total LNG volume decreased from 77 billion cubic meters to 51 billion cubic meters, resulting in a shortage of 26 billion cubic meters. By April, inventory levels dropped to about 6%, and they did not return above 20% until June.
Further sensitivity testing shows that if LNG is retained at 80% of last year's level, the inventory low point would be close to the severe winter levels; if retained at 70%, the low point would be around 9 billion cubic meters; if only 60% is retained, it would be almost depleted by April. Therefore, a more practical indicator than simply betting on temperatures is the difference between the arrival of LNG each month and that of the same month last year.
The gas that has already been saved cannot be counted again.
European demand has indeed declined. EU consumption decreased from 413 billion cubic meters in 2021 to 332 billion cubic meters in 2024, a reduction of about 20%. In the first seven months of 2026, gas usage increased slightly compared to the previous year, but it was still 19% lower than in the same period of 2021. Residents, industry, power plants, and the service sector all contributed to this adjustment.
Part of this comes from weather factors. The author used monthly consumption, heating, and cooling demand data from various countries to build counterfactual models and estimated that even after accounting for weather effects, demand would still be about 15% lower from 2023 to 2025 than before the crisis; in the first seven months of 2026, it would be about 13% lower. Therefore, attributing the entire historical decline solely to permanent energy savings would overestimate the demand buffer.
A strong El Niño event might benefit Europe, but the baseline already assumes four milder winters. Studies estimate that a winter about 6% milder than the trend could result in a reduction of about 4 billion cubic meters of gas not used for power generation; relative to this already milder baseline, additional savings would amount to only about 2.5 billion cubic meters.
The author also notes that although this historical evidence is only from five strong El Niño winters since 1980, the possibility of cold waves cannot be ruled out. The additional warmth brought by these warm winters, along with the reduction of 26 billion cubic meters in water volume due to import shortages, is still a significant difference. The latter comparison is a contrast of scenario values, not a weather forecast.
For readers who are concerned about the costs of LNG suppliers in the United States and European industries, the article provides very specific observations: focus on the quantity of goods received and consumption adjusted for weather conditions; do not directly equate low inventory levels with corporate profits. Even if the baseline scenario allows for a smooth winter, the next round of inventory replenishment will still start from even lower levels of inventory, and there will be a greater need for inflows during the winters of 2027 to 2028.