













Newsletter
- On Thursday, Bitcoin traded around $62,640, and Anthropic's record-breaking debut on the market failed to boost the broader stock market.
- Bitcoin's 50-day EMA is below the 200-day EMA; the chart itself does not show exactly when this crossover occurred. RSI is 21.3, and ADX is 41.2.
- If it falls below $62,019, it could open the way for a drop to $60,000; to resume its upward trend, it first needs to break through the resistance around $66,512.
On Thursday, Bitcoin traded at around $62,640, down 0.6% for the day. Meanwhile, Anthropic's record-breaking debut in the stock market failed to reverse the broader selling of risk assets.
Since reaching a high of nearly $87,000 at the end of September, this cryptocurrency has fallen by about 28% in total, and there currently seems to be no sign of a stop to this decline.
Market enthusiasm stops at the stock code itself of Anthropic.
As of 12:18 p.m. Eastern Time, the Nasdaq Composite Index fell by 1.55%, the S&P 500 Index fell by 1.59%, and the Dow Jones Industrial Average fell by 2.03%. Investors are still concerned about the costly infrastructure investments in AI, as well as whether these expenditures will generate sufficient returns. In addition to Anthropic, the weak market response has dampened hopes that a major IPO could reignite the risk appetite for battered tech stocks.
The weakness in the crypto market was evident before this listing on Thursday. American spot Bitcoin ETF has seen an outflow of approximately $2.9 billion this month, with a single-day outflow of $306.4 million on Wednesday; this is against the backdrop of rising U.S. Treasury yields and market expectations that the Federal Reserve will further raise interest rates.
Some traders believe that this time, IPO has diverted funds that would otherwise have entered the crypto market, but this claim has not yet been confirmed. As Decrypt previously pointed out, Bitcoin and AI stocks have been declining in tandem, which suggests that it is more likely a general withdrawal of risk appetite, rather than a simple shift of funds to Anthropic stocks.
Bitcoin Price Analysis: EMA, RSI and Prices Worth Paying Attention To
The daily chart of Bitcoin still shows a clearly bearish trend. Around $62,640, BTC is below its 50-day and 200-day exponential moving averages ( EMA ), and the short-term moving averages are situated below the long-term moving averages.
This is a bearish pattern that is usually associated with the "death cross" based on EMA. Traditionally, a "death cross" refers to the 50-day simple moving average crossing below the 200-day moving average, indicating a deterioration in short-term momentum. The EMA version responds more quickly to recent price changes. It is mentioned in the text that this cross has been confirmed today.
The Average Directional Index ( ADX ) is 41.2. ADX measures the strength of a trend, not its direction; generally speaking, a reading above 25 indicates a stronger trend. Currently, the negative directional indicator is higher than the positive one, confirming that sellers have the upper hand. Even though RSI has deeply entered an oversold area, a high reading on ADX does not necessarily mean that a reversal is imminent.
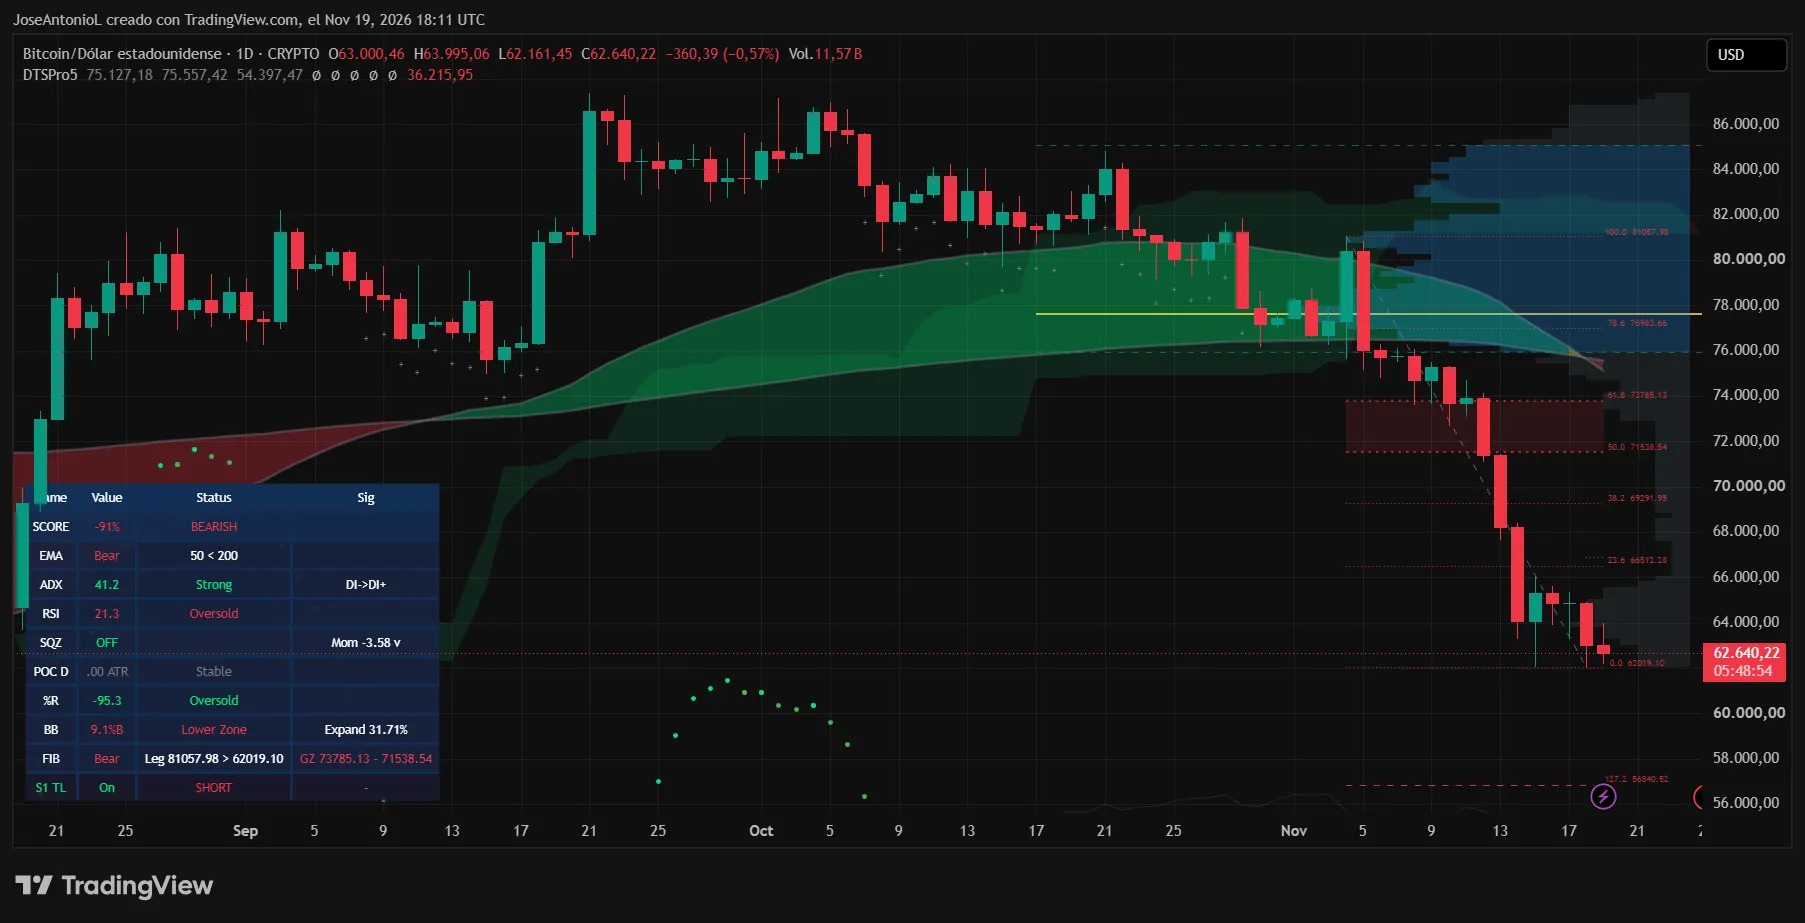
Since September, Bitcoin has also been forming lower highs and lower lows, with the sharp decline in November breaking through multiple support levels. For a bullish reversal to occur, the price first needs to rebound above $66,512, and then it will face resistance at around $69,292 and $71,539. If these levels are broken through, $73,785 and $76,984 will pose an even more severe test to the current bearish structure.
On the downside, the chart shows that the immediate support level, which is almost directly below the current price, is around $62,019. If the daily decisively closes below this level, it could open the way for a decline towards the psychological barrier of $60,000, followed by the next Fibonacci extension level on the chart, which is approximately $56,841.
RSI indicates that there is still room for a price rebound, but EMA and ADX suggest that buyers still have a lot of work to do. If it breaks above $66,512, the next target could be $69,292; if it closes below $62,019, then the market's focus will shift back to $60,000.
Disclaimer
The views and opinions expressed by the author are for reference only and do not constitute financial, investment, or other advice.