
















Bitcoin's price has returned above the $80,000 mark today, but ETFs saw outflows of $1.16 billion in three days. Can this rally hold? Let's state the conclusion first: $80,000 can hold in the short term, but what is holding it up is not institutions, but "passive defense." ETFs withdrew $1.16 billion in three days, yet the price managed to return above $80,000. This divergence itself indicates that selling pressure comes from sentiment, while absorption comes from structural buying. The question we should be asking is not "will $80,000 break," but "who is buying below $80,000."
Table: Overview of Bitcoin Today's Market Data
| Data Dimension | Specific Value |
|---|---|
| Latest Price | $80,675 |
| 24-Hour Change | +3.80% |
| Market Cap | Approx. $1.62 Trillion |
| 24-Hour Trading Volume | Approx. $39.75 Billion |
| BTC Perpetual Contract Open Interest | Approx. $2.772 Billion |
| BTC Perpetual Funding Rate | 0.0074% (8-hour) |
| 24-Hour Network-Wide Liquidations | $992 Million |
| Bitcoin Single-Asset Liquidations | Shorts $310 Million / Longs $87 Million |
| 24-Hour Long/Short Account Ratio | 1.59 |
| US Spot BTC ETF 3-Day Net Outflows | Approx. $1.16 Billion |
Note: The above content is compiled and summarized by CoinMeta based on public market data. Please refer to actual data if there are any fluctuations.
What Do the $1.16 Billion ETF Outflows Mean?
According to CoinMeta data, from October 30 to November 3, US spot Bitcoin ETFs saw net outflows for three consecutive trading days, totaling $1.1574 billion.
Breaking it down, the outflow curve is rapidly converging:
From the chart above, we can analyze that BlackRock's IBIT saw a total outflow of $734 million over the three days, accounting for 63.4% of the total outflows; however, by November 3, IBIT's outflow had narrowed to $95 million.
So, what caused the $1.16 billion in Bitcoin ETF outflows?
In our view, the trigger for this round of outflows was a Binance security incident around $6.3 billion, combined with risk-off sentiment ahead of the US midterm elections. Additionally, the incident triggered about $1.5 billion in crypto position liquidations, of which about 85% were long leverage. We judge that the drop in Bitcoin ETF outflows from $640 million to $110 million over three days indicates that the peak of panic redemptions has most likely passed.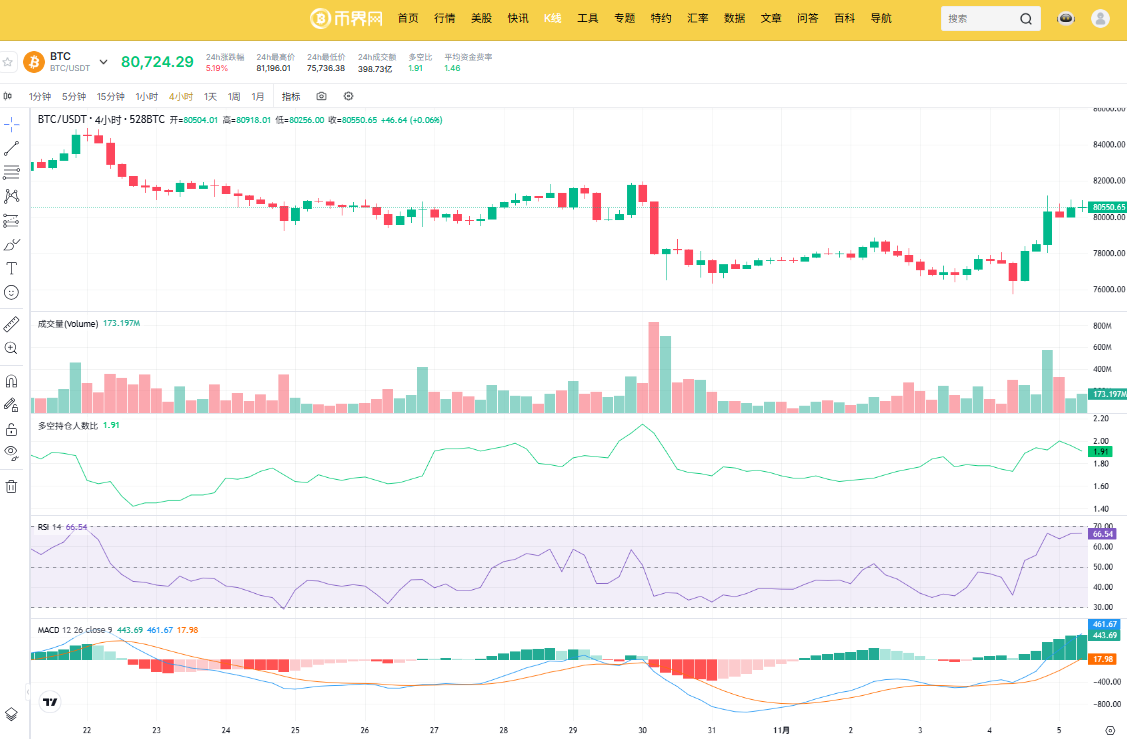
Image: Bitcoin ETF Inflows and Outflows
Bitcoin Today's Market Analysis
Bitcoin 4-Hour Candlestick Analysis
According to CoinMeta's BTC/USDT 4-hour chart (as of November 5), we can analyze that the current market shows a typical "V-shaped recovery after a sharp drop + high-volume breakout" structure. Although the price has returned to $80,724, technical indicators are beginning to show signs of short-term overheating. Here is the multi-dimensional in-depth analysis:
MACD: After forming a "golden cross" below the zero axis, the fast and slow lines are accelerating upward, and the red momentum histogram continues to expand. This is a strong short-term bullish signal, indicating that bulls are regaining control.
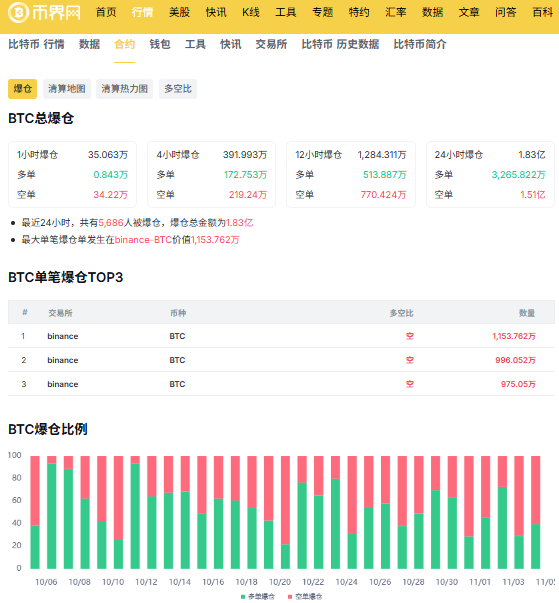
Image: Bitcoin 4H Trend
RSI: 66.54, rapidly approaching the 70 overbought warning line. Combined with the price's short-term surge of over 5%, RSI will likely hit above 70 on the next 4H candle, suggesting a need for a short-term pullback and repair.
Long/Short Account Ratio: 1.91. During the significant price rebound, this ratio has actually pulled back from high levels. Our analysis suggests that some retail longs are taking profits on the rally, or shorts are adding positions against the trend.
Bitcoin Liquidation Analysis
According to the "BTC Total Liquidations" data chart, we believe it perfectly confirms the "V-shaped recovery + high-volume breakout" mentioned in the 4H chart analysis above. This rally back above $80,000 was essentially a precise "major short squeeze" hunting shorts, led by Binance.
24-hour data: Total liquidations were $183 million, of which shorts reached $151 million, and longs were only $32 million.
Top 3 single liquidations: All on Binance, and all were "short positions," with the largest single liquidation reaching $11.537 million. We believe that during this rally from $76,000 to $81,000, large capital used high leverage to short on Binance, only to be directly liquidated by strong spot buying, becoming "fuel" for the bulls.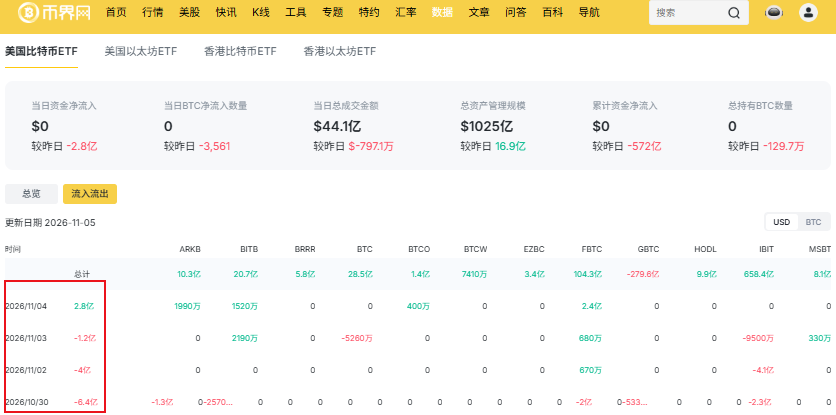
Image: Bitcoin Liquidation Data
Combined with the "ETF outflows of $1.16 billion" and the "Binance security incident" mentioned earlier, the macro and news fronts were originally bearish. A large number of retail traders and some institutions took the opportunity to short, or tried to short near the $80,000 resistance level.
Can Bitcoin Hold $80,000?
Faced with Bitcoin's price returning to $80,000 today and ETFs outflowing $1.16 billion in 3 days, can it still hold $80,000? Combining the 4H candlestick chart and liquidation data, our clear conclusion is: it can hold $80,000 in the short term, likely oscillating and consolidating within the $80,000-$81,200 range, and it will be difficult to form a trend reversal in the short term.
Here is the cross-validation analysis based on the two charts:
Technicals: Bullish Momentum Is Strong, But Overhead Pressure Is Heavy
From the 4H chart, after completing a wick bottom at $75,736, the price consecutively printed solid bullish candles with expanding volume, strongly breaking through the $78,000 and $80,000 thresholds. The MACD has formed a golden cross below the zero axis and is accelerating upward.
However, the hidden risk is: the current price ($80,724) has just run into the dense trading area ($81,000-$82,000) where the October 29-30 crash originated. This is the trapped cost zone of a large number of earlier longs, resulting in heavy breakeven selling pressure; at the same time, the RSI indicator has reached 66.54, approaching the overbought red line.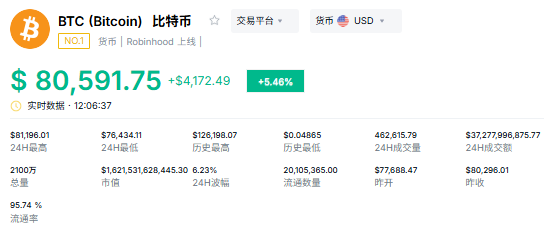
Image: Bitcoin Latest Price
Capital Flows: Liquidation Chart Reveals Short Squeeze
Within 24 hours, short liquidations reached $151 million, and the top three single liquidations were all on Binance, all in the tens of millions of dollars.
This shows that during the price breakout above $80,000, passive limit buy orders in the $77,000-$80,000 range combined to form the bottom defense at $80,000. In our view, as long as shorts continue to resist at this level, the $80,000 support remains valid.Our View: $80,000 is the Psychological Threshold, $78,000 is the Trend Baseline
Combined with the earlier data showing decelerating ETF outflows, $80,000 is the psychological threshold, and $78,000 is the trend baseline. Bitcoin needs sideways consolidation to digest profit-taking.
Signal that it can hold: As long as the price retests on shrinking volume without breaking below $78,000, the $80,000 psychological support holds, and bulls remain in control.Signal of defense line emergency: If it breaks below $78,000 on heavy volume, it means this short squeeze has failed, and the market will retest the ultimate defense line at $76,800.FAQ
Q1: Will Bitcoin definitely fall if ETFs see outflows?
A: Not necessarily. The article notes that ETFs saw $1.16 billion in outflows over three days, but the outflow rate is rapidly decreasing. The current $80,000 support is mainly absorbed by passive limit buy orders in the $77,000-$80,000 range and whale withdrawals. The peak of panic redemptions may have passed, and capital outflows are not the sole determinant of price movements.

Q2: Can Bitcoin stabilize after returning to $80,000?
A: It can stabilize in the short term, but it is a passive defense. The analysis points out that support below $80,000 mainly comes from pre-placed limit orders and the short squeeze thrust from $151 million in short liquidations within 24 hours. The true trend defense line is at $76,800; if broken, the defense logic becomes invalid.
Conclusion
The clear conclusion from today's Bitcoin market analysis is: $80,000 can hold in the short term, but the supporting force mainly comes from passive limit orders and short liquidations, not active spot capital. The peak of ETF outflows is passing, and panic sentiment is weakening. It is recommended to closely watch the $76,800 ultimate defense line and whether ETFs turn to net inflows. Only when spot buying shifts to "actively chasing prices" can the market transition from a repair to a true reversal.
Disclaimer: Readers are strictly advised to comply with local laws and regulations. This article is compiled based on public market data for reference and educational purposes only, and does not constitute investment advice. Follow CoinMeta for the latest updates.