














The daily chart structure of Ferrari stock prices shows many patterns, but the picture during trading hours is not that simple.

The price is above the daily moving average and the upper band of the Bollinger Bands. However, the hourly readings indicate overbought conditions, and there is resistance in the vicinity, making short-term judgments more conditional rather than clear at a glance.
The key points are as follows:
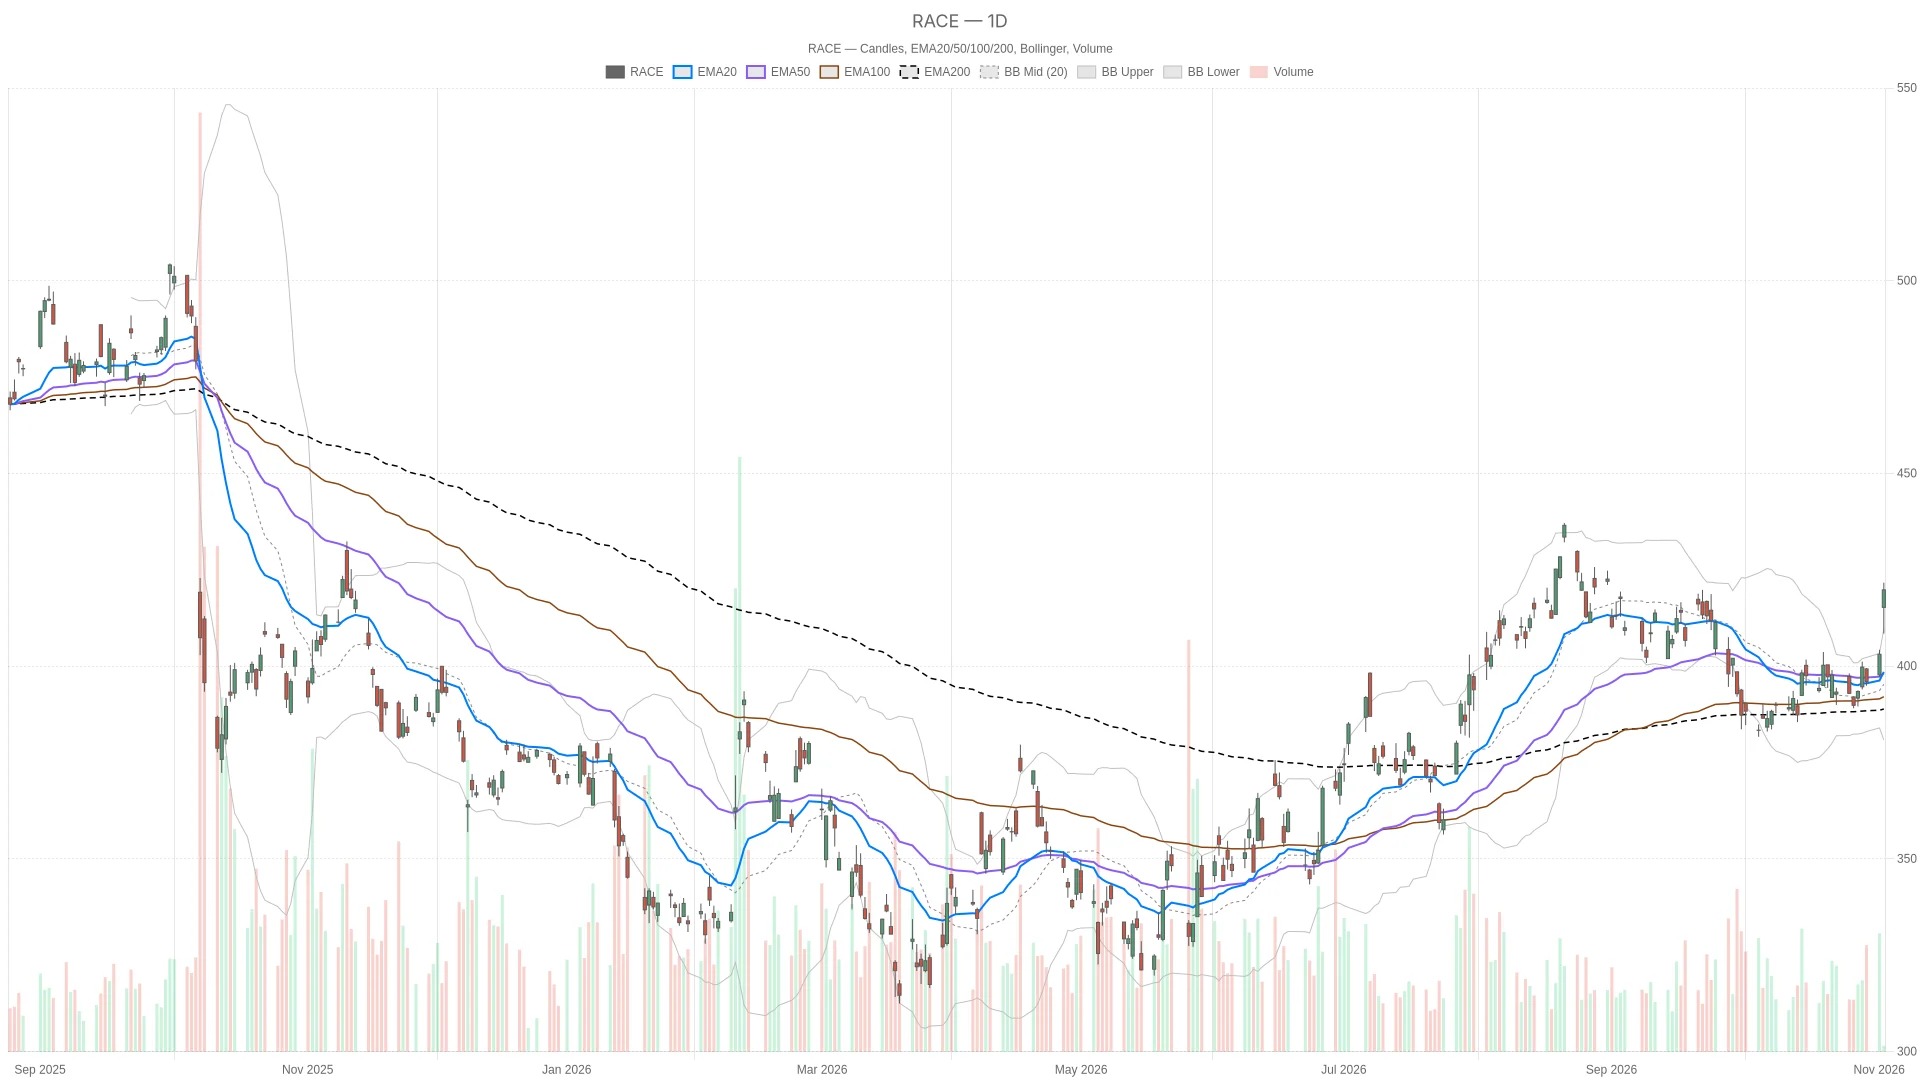
- As of 12:46 Eastern Time on Tuesday, the stock price of Ferrari was reported at $419.8, up 4.15% from the closing price of the previous trading day.
- The daily line RSI14 is at 66.67, which is below the overbought threshold of 70; the daily line MACD bar chart shows a value of 2.59, which is in the positive range.
- The daily line ATR14 is at $7.6, which is higher than the previous trading day's $6.76.
- The hourly line RSI14 is at 79.7, and the 15-minute line RSI14 is at 77.43, both of which are above the overbought threshold of 70.
- The price is above the upper band of the daily Bollinger Bands at $409.75, but below the hourly pivot point of $420.58 and the 15-minute pivot point of $420.15.
On Tuesday, November 3, 2026, Ferrari opened at $415.25, with a low of $408.45 and a high of $421.67 during the session. The daily candlestick chart started at $415.25, with a range of $408.45 to $421.67, and the latest price was $419.80, compared to the previous closing price of $403.09. As of 12:46 Eastern Time, the stock price was $419.80, representing a 4.15% increase from the previous closing price. Trading for the day is still in progress.
Ferrari Stock Price Daily Chart Maintains a Bullish Trend
The daily chart supports a bullish judgment for the Ferrari stock price, with the price located above the three exponential moving averages and the upper band of the Bollinger Bands. This positioning maintains the integrity of the larger-scale trend structure.
Moving Average Alignment and Bollinger Bands Position
The daily moving averages are arranged below the price, showing a bullish trend. The 20-day moving average is $398.51, the 50-day moving average is $398.16, and the 200-day moving average is $388.48. This arrangement supports a bullish judgment, however, the shorter-term moving averages are significantly lower than the current price.
It is worth noting that the price is above the upper band of the daily Bollinger Bands at 409.75 USD. The middle band is at 395.3 USD. This means that the price is outside the upper band, rather than near the middle of the daily distribution.
Daily Line Momentum and Volatility Readings
The daily line RSI14 is at 66.67, which is above neutral but below the overbought threshold of 70. The daily line MACD is at 1.35, which is higher than the signal line of -1.23, and the bar chart shows a value of 2.59, which is positive. Both of these readings support a bullish judgment at the daily level.
The daily chart ATR14 has risen to $7.6, above $6.76, indicating an expansion in the absolute range of fluctuations. The daily pivot point is at $401.52, the first resistance level is at $405.82, and the first support level is at $398.8. The price is currently above all three of these levels. These levels come from the previous completed daily candlestick chart and still serve as reference points for the current trading session.
RACE The hourly chart shows an overbought structure, but there are signs of overbuying.
The hourly chart confirms the bullish structure of the daily chart, but it also results in overbought readings, making the timing of immediate entry more complex. The price is still above the 20-hour EMA at $405.52, the 50-hour EMA at $400.11, and the 200-hour EMA at $399.07. These levels are arranged in descending order below the current price, indicating a bullish structure.
However, on the hourly chart RSI14, the price fell from 83.46 to 79.7, still remaining in an overbought zone. The hourly chart MACD shows a level of 5.55, which is higher than the signal line of 3.31. Its bar chart indicates an increase from 2.17 to 2.24, and although RSI has fallen, it still remains in a positive range.
The price is also above the upper band of the hourly Bollinger Bands at $419.19, but below the hourly pivot point of $420.58. The first support level on the hourly chart at $419.5 is slightly lower than the current price, while the first resistance level is at $422.22. Therefore, the hourly chart confirms a bullish structure on a larger scale, but it makes it more difficult to grasp the immediate momentum.
Ferrari Short Scenario: Pivot Points and Conditional Timing
The short-term outlook for the stock price of Ferrari is conditional, depending on whether the price can hold its support level while breaking through the nearby central axis of the chart. On the 15-minute chart, RSI14 is at 77.43, also in an overbought range. The MACD bar chart shows a value of 0.39, which is positive. The MACD line is at 5.03, still above the signal line of 4.64. These readings are more about adjustments to the timing of execution rather than overturning the overall bullish judgment for the daily chart.
At the same time, the price is above the 20-period EMA of the 15-minute chart at $414.36, but below the pivot point of $420.15 for that period. The first support level is $419.23, and the first resistance level is $420.76. Both the hourly chart and the 15-minute chart's pivot points are calculated based on the previous completed candlestick chart.
To be bullish, it is necessary to break through the central axis of the market.
For a bullish scenario, it is necessary to first hold the support levels on the hourly chart and the 15-minute chart nearby, and then break through the 15-minute pivot point of $420.15. Further confirmation will require reaching the hourly chart pivot point of $420.58 and the first resistance level of $420.76 on the 15-minute chart. If the trend continues upward, the next hurdle before the intraday high of $421.67 is the first resistance level of $422.22 on the hourly chart.
Risk of breaking below nearby support levels
On the contrary, if it falls below the first support level of 419.5 USD on the hourly chart and the first support level of 419.23 USD on the 15-minute chart, the bullish outlook for the short term will be weakened. If it falls below 414.36 USD (which is marked as EMA on the 15-minute chart), the upper band of the daily Bollinger Bands at 409.75 USD will become a more significant reference point. If it further falls below the daily pivot point of 401.52 USD, the structure will continue to be damaged. If it falls below the range of 398.51 USD to 398.16 USD (marked as EMA on the daily chart), the main bullish arguments will be invalidated.
Overall, the stock price of Ferrari is still above the daily trend reference level, but below the nearby pivot point. The daily chart of ATR shows a larger range of fluctuations, while the hourly chart of RSI14 indicates 79.7, and the 15-minute chart of RSI14 shows 77.43, both of which are above the overbought threshold of 70. Whether the price can break through these pivot points while maintaining the nearby support levels remains to be further verified during the current trading session.
Frequently Asked Questions
What is the daily technical outlook for the stock price of Ferrari?
There are more daily charts. The price is above the 20-day EMA of $398.51, the 50-day EMA of $398.16, and the 200-day EMA of $388.48, as well as above the upper band of the daily Bollinger Bands at $409.75. The daily RSI14 indicator is at 66.67, which is below the overbought threshold of 70, while the MACD bar chart shows a value of 2.59, which is in the positive range.
Ferrari Does the stock price show signs of overbought conditions?
Yes, it appears on the intraday chart cycle. The hourly line RSI14 is at 79.7, and the 15-minute line RSI14 is at 77.43, both of which are above the overbought threshold of 70. However, the daily line RSI14 is at 66.67 and has not yet entered the overbought range.
What are the key resistance levels for Ferrari's stock price?
The recent resistance levels are the 15-minute pivot point of $420.15, the hourly pivot point of $420.58, and the first 15-minute resistance level of $420.76. Looking further up, the intraday high of $421.67 and the first hourly resistance level of $422.22 are the next levels that need attention.
What would weaken the bullish outlook for Ferrari stock price?
Falling below the first support level of 419.5 USD on the hourly chart and the first support level of 419.23 USD on the 15-minute chart will weaken the bullish outlook for the short term. If it falls below the 15-minute EMA level of 414.36 USD, the upper band of the daily Bollinger Bands at 409.75 USD will become a more significant reference point. If it further falls below the daily pivot point of 401.52 USD and the daily EMA range of 398.51 USD to 398.16 USD, then the main bullish arguments will be weakened.
Cryptonomist and the author do not hold any positions in the financial instruments mentioned in this text, nor have they received any compensation from the companies reported.
This article was generated with the assistance of artificial intelligence and has been reviewed by an editorial team.
Lorenzo Marcek
Lorenzo Marcek is a financial journalist and senior crypto market analyst, known for his clear, data-driven reporting on digital assets. With a background in economics, he has been covering global markets for over a decade, focusing on on-chain indicators, institutional adoption trends, and macroeconomic factors that drive crypto market fluctuations. His work combines investigative journalism with technical market insights, making him a trusted voice among traders.