














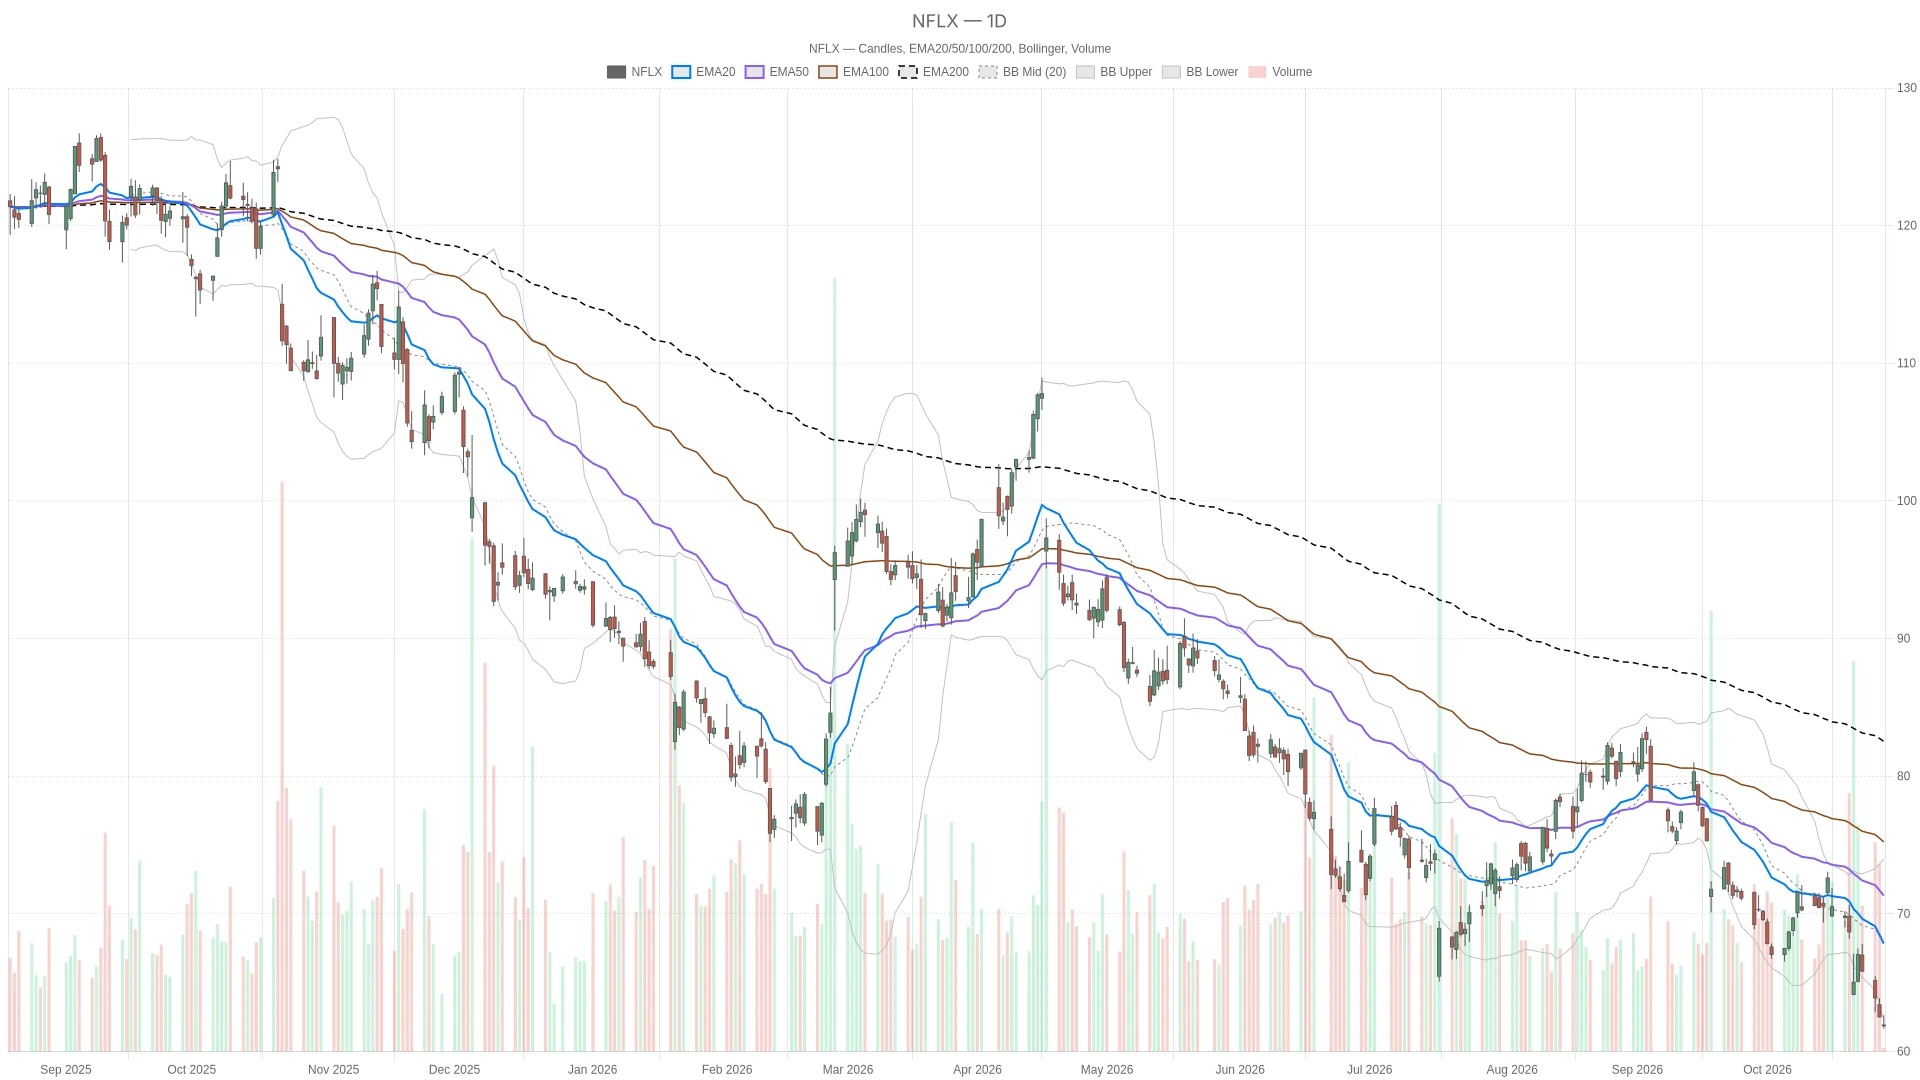
Netflix Stock analysis shows that the stock price is at $61.87, down 1.04%. The daily chart structure is below key technical levels, indicating a bearish trend.

The daily chart pattern of Netflix stock is bearish, although the 15-minute MACD bar chart has turned positive. The stock price is below all three daily moving averages and the lower band of the Bollinger Bands. The hourly chart supports this bearish judgment, while shorter time frames provide only limited counter-signals.
Key Points
- As of 12:08 on Wednesday, October 28, 2026, Eastern Time, the stock price of Netflix was reported at $61.87, a decrease of 1.04% from the previous closing price of $62.52.
- The daily line RSI14 is at 30.06, close to the oversold threshold; the daily line MACD bar chart shows -0.61.
- The stock price is below the lower band of the daily Bollinger Bands at $62.25, and also below the first daily support level of S1 at $62.04.
- The 15-minute MACD bar chart shows a value of 0.01, which is higher than the previous K-line's value of -0.01; the 15-minute RSI14 value is 33.07.
- The daily line ATR14 is at $2.05, which is lower than the previous daily K-line value of $2.13.
Netflix Stock Price and Trading Hours on Wednesday
As of 12:08 on Wednesday, October 28, 2026, Eastern Time, the stock price of Netflix was reported at $61.87, a decrease of 1.04% from the previous closing price of $62.52. The opening price on Wednesday was $61.92, with a lowest price during the session at $61.66 and a highest price at $62.65. This trading session is still in progress.
Netflix Stocks face a bearish daily structure
The daily technical structure is bearish; the Netflix stock price is below all three exponential moving averages and the lower band of the Bollinger Bands.
Daily trend structure
The daily moving averages are in a bearish arrangement and all lie above the stock price. The 20-day EMA is at $67.84, the 50-day EMA is at $71.33, and the 200-day EMA is at $81.7. The broader structural pattern still does not support a bullish outlook.
Daily Momentum Reading
The daily line RSI14 is at 30.06, close to the oversold area, but still above that threshold. Meanwhile, the daily line MACD is at -2.51, below its signal line of -1.9, and the bar chart shows a negative value of -0.61. This relationship supports a bearish interpretation.
Bollinger Bands Position
The stock price is below the lower band of the daily Bollinger Bands at 62.25 USD. The middle band is 68.11 USD, and the upper band is 73.98 USD. It is worth noting that being outside the lower band indicates that the downtrend may be extending, but it does not necessarily mean that a reversal has occurred.
Daily Pivot Points and Volatility Context
The daily line ATR14 is at $2.05, which is lower than the previous daily K-line's value of $2.13. This indicates that the average range of fluctuations has narrowed, rather than a change in directional preference. The first support level on the daily chart, S1, is at $62.04, which is higher than the current stock price. The daily pivot point of $62.96, as well as the first resistance level R1 at $63.43, are also above the current price. These levels come from the previous complete daily K-line and are applicable to the current trading period.
Hourly chart confirms divergence from short-term trend
The hourly chart confirms a bearish trend, while the 15-minute chart only provides limited positive contrarian signals.
Hourly Trend and Momentum
The hourly exponential moving averages are in a bearish arrangement and are located above the stock price. The 20-hour EMA is at $63.36, the 50-hour EMA is at $65.42, and the 200-hour EMA is at $70.15. The hourly RSI14 is at 25.17, which is in an oversold area; the hourly MACD bar chart still shows a negative value of -0.02. The oversold condition makes short-term timing more complex, but the hourly chart does not overturn the bearish judgment of the daily chart.
15-minute signals and local pivot points
On the 15-minute chart, the MACD bar chart crosses above the zero line from -0.01 of the previous candlestick to 0.01. Its RSI14 value rises from 29.12 to 33.07, which means it has exceeded the oversold threshold, but it is still below 50. These are positive short-term indicators within a larger bearish trend. The stock price is still below the 15-minute 20-period EMA level of $62.13, as well as the middle band of the Bollinger Bands at $62.19.
From an execution perspective, the stock price is above the 15-minute pivot point of $61.8 and is at par with its first resistance level of $61.87. The stock price is also higher than the hourly pivot point of $61.74 and the hourly first resistance level of $61.83. Overall, these nearby levels explain the current mixed picture: the local pivot points provide support, while the hourly and daily moving averages remain above, exerting pressure.
Netflix News Background of Stocks
An article published before the opening on Wednesday maintained a bullish outlook. The article was written by a contributor from Seeking Alpha and mentioned that revenue growth was 12%, which is the slowest rate in three years.
The article also describes a slowdown in growth, while still maintaining a bullish stance. However, this is merely the judgment of the author of the contribution and does not prove that the bearish trend depicted in the charts has changed.
Netflix Conditional Scenarios for Stocks
Both bullish and bearish scenarios depend on the levels of $62.04 and $62.25. If these levels cannot be regained, the bearish scenario will remain unchanged.
Bullish scenario
A bullish scenario first requires that the Netflix stock price reclaims above the daily level of $62.04, as well as the lower band of the daily Bollinger Bands at $62.25. These are merely gradual improvements and do not indicate that the daily structure has been completely restored.
Bearish scenario
On the contrary, if it fails to regain levels of $62.04 and $62.25, the bearish scenario will remain unchanged. If it falls below the 15-minute pivot point of $61.80, that would weaken the short-term bullish argument. Subsequently, the hourly pivot point of $61.74 and the first hourly support level of $61.62 will become key observation points for further declines.
However, despite being positioned above the central axis in the nearby area, Netflix is still below the daily support level and the lower band of the Bollinger Bands. The daily ATR14 at $2.05 defines the current volatility context. The unresolved issue is: in a situation where the hourly structure remains bearish, whether positive signals at the 15-minute level can push prices back above the key daily levels.
Frequently Asked Questions
What is the current intraday price of Netflix stock?
On Wednesday, October 28, 2026, at 12:08 Eastern Time, the stock price of Netflix was reported at $61.87, a decrease of 1.04% from the previous closing price of $62.52. This trading session is still in progress.
What does the daily technical structure show?
The daily chart structure is bearish. The stock price is below the 20-day EMA of $67.84, the 50-day EMA of $71.33, and the 200-day EMA of $81.7, and it is also below the lower band of the daily Bollinger Bands at $62.25.
Which levels are most important for a bullish scenario?
A bullish scenario first requires a rebound above the daily level of $62.04 for S1, as well as above the lower band of the daily Bollinger Bands at $62.25.
What does the 15-minute indicator show?
The 15-minute MACD bar chart shows a value of 0.01, which is higher than the previous K-line's value of -0.01. The 15-minute RSI14 value is 33.07, which is also higher than the previous value of 29.12; at the same time, the stock price is still below the 15-minute 20-period EMA value of $62.13, as well as the middle band of the Bollinger Bands, which is $62.19.
Neither Cryptonomist nor the author holds any positions in the financial instruments mentioned in this text, nor have they received any compensation from the companies reported.
This article was generated with the assistance of artificial intelligence and has been reviewed by an editorial team.
Lorenzo Marcek
Lorenzo Marcek is a financial journalist and senior crypto market analyst, known for his clear and data-driven reporting on digital assets. With a background in economics and over a decade of experience covering global markets, he focuses on on-chain indicators, institutional adoption trends, and macroeconomic factors that drive crypto market fluctuations. His work combines investigative journalism with insights into the technology market, making him a trusted source for traders seeking solid and actionable analysis.