

Brief
- Bitcoin ( BTC ) tests the $80,000 mark
- Binance Coin ( BNB ) hovering above $700
- Hyperliquid ( HYPE ) Testing the key support level around $77
- Cardano ( ADA ) Sliding towards the 100-day moving average
Brief
- Bitcoin ( BTC ): Bitcoin is testing $80,000 and the 50-day moving average of nearly $80,300. If the daily close falls below this level, it will be the first warning that the upward trend is weakening.
- Binance Coin ( BNB ): Trading at around $717, close to the crucial support level of $700; after a decline of about 11% from the high of $810, sellers still hold the upper hand.
- Hyperliquid ( HYPE ): The HYPE transaction was at around $77.80, slightly above the 100-day moving average of $77; if the daily closing price falls below $75, the rebound in August will be at risk.
- Cardano ( ADA ): The ADA transaction was around $0.219, near the 100-day moving average of $0.220; before it managed to break above $0.230 again, sellers still had the upper hand.
Bitcoin ( BTC ) tests the $80,000 mark
After a slow decline from recent highs, Bitcoin has once again tested the $80,000 mark. The price is close to $80,100, with a decrease of about 1.8% on the day. The intraday low touched $80,000, and buyers entered the market at that level, but the rebound was limited.
This round of decline occurred after a previous strong upward trend. Bitcoin rose from around $63,000 in August to nearly $87,500 in late September. It failed to break through further at the beginning of October and has now retraced about 8% from its high point. Charts show that since then, the high points have been continuously moving lower, indicating that sellers are more active.
The current price is exactly near the 50-day moving average, which is close to the blue line at $80,300. Since the breakout in August, this line has been supporting the trend, making it very crucial. Bitcoin has fallen below the shorter-term moving averages, which are currently located higher, around $81,200 and $82,400.
If this happens, the next support level will be between $77,000 and $78,000. This area served as support in September, and below it there is also a 100-day moving average of around $76,600 and a 200-day moving average of around $75,600. Together, they form a solid support base. A return to this range will not undermine the larger trend, but it will erase most of the recent gains.
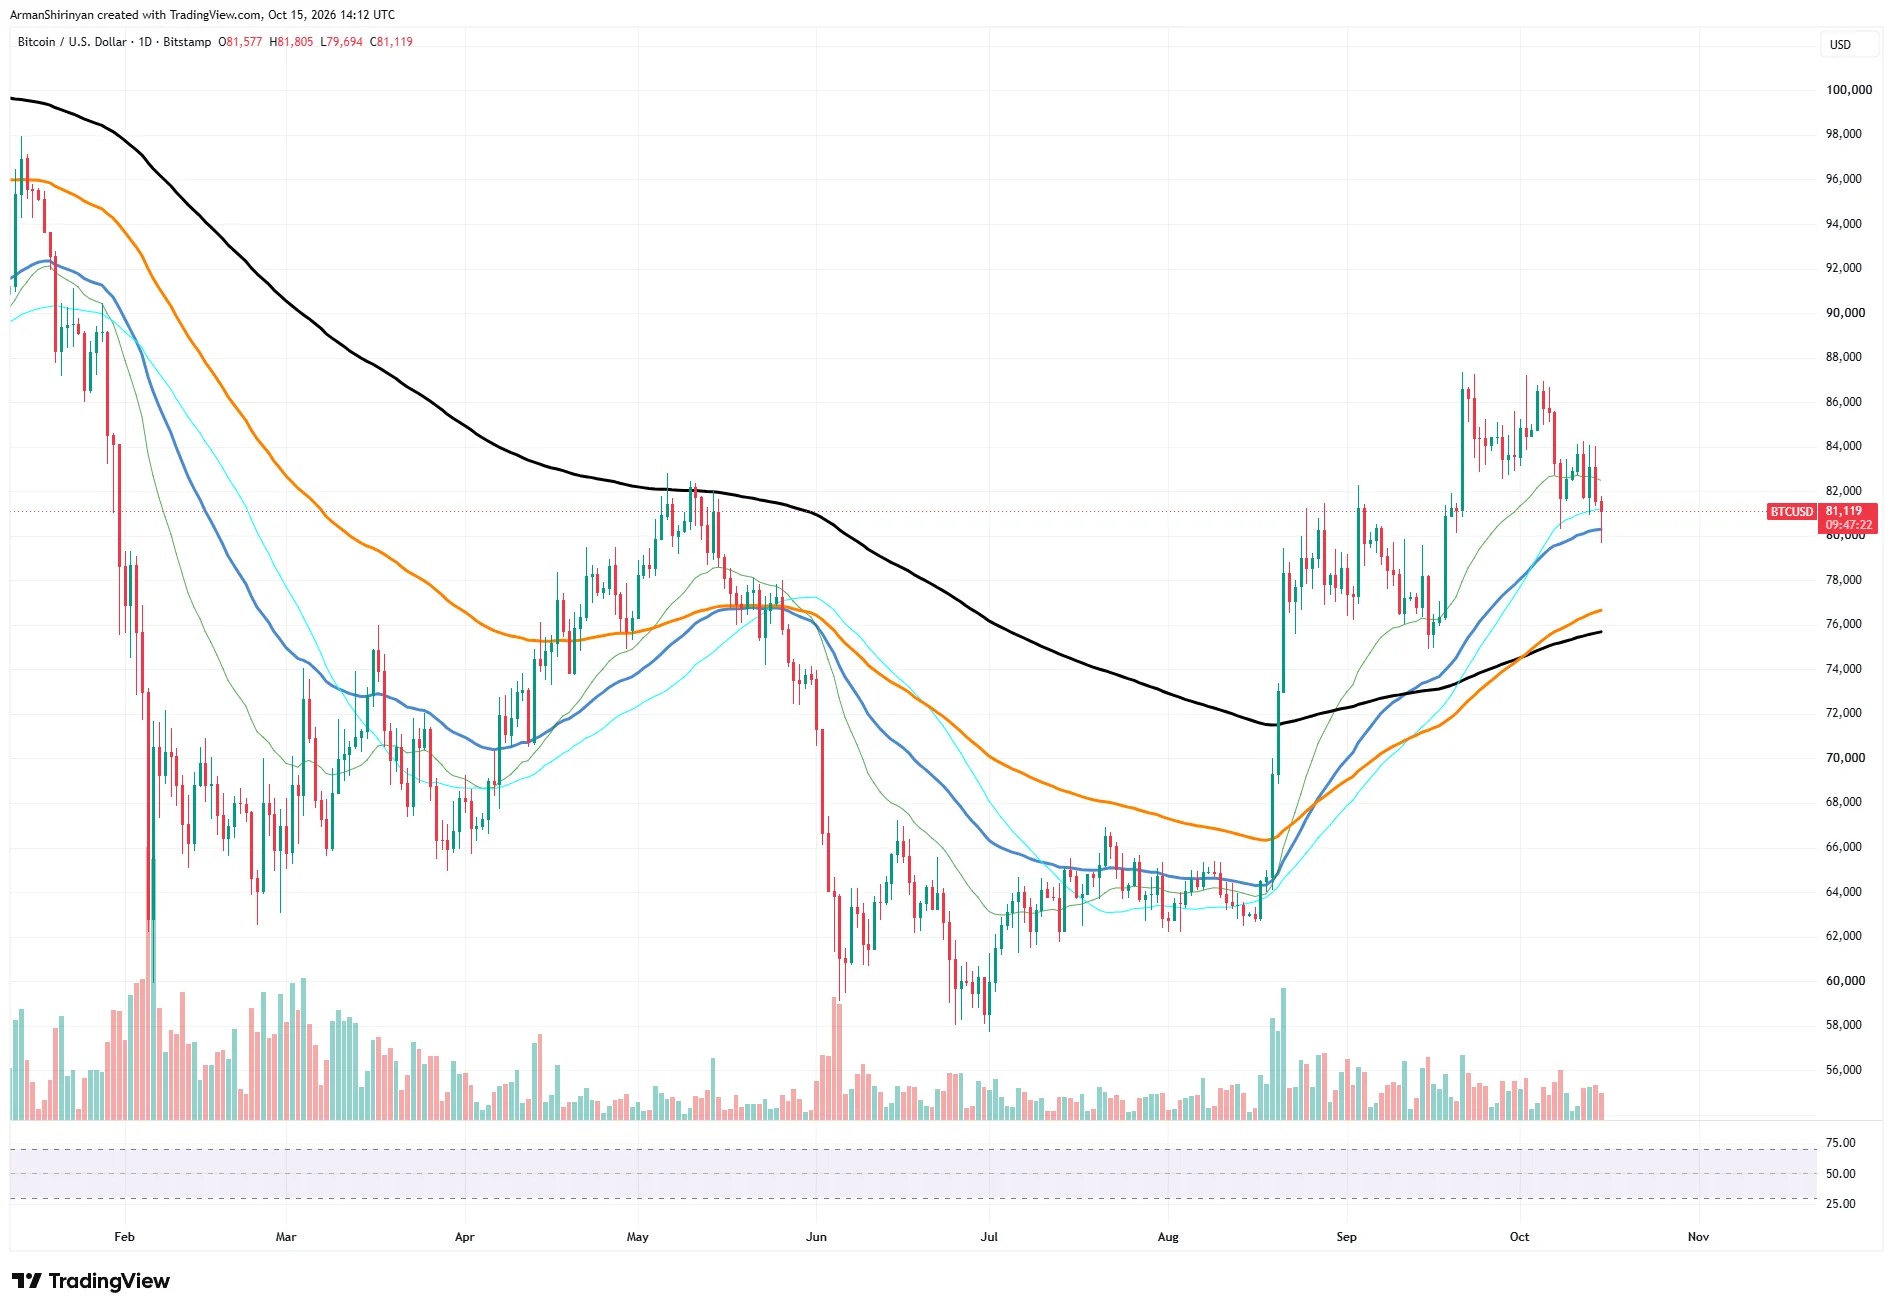
Trading volume also sends a relatively calm signal. The recent bearish candles have not been accompanied by high trading volumes, so this is more like a gradual selling off rather than a panic sell-off. This is not necessarily bad for the bulls, but it also indicates that buyers have not yet shown strong interest. A real rebound usually requires a significant increase in trading volume.
For the bulls, the task is simple: Bitcoin needs to hold above $80,000 and re-establish itself above $82,400, which is also the area where short-term moving averages converge. In that case, recent declines will be seen as normal corrections. If it can further recover to $84,000, it might open up space towards the $87,500 high. For the bears, if the price falls below $80,000 amid increased trading volume, it could drop to around $77,000 within a few days. The next few daily closes will determine the direction.
Binance Coin ( BNB ) hovering above $700
BNB fell by about 1.2% on the day, trading around $717. The price had previously dropped to $708.89, but then buyers pushed it back up slightly. Nevertheless, the coin is still under pressure and is approaching a crucial test.
BNB has performed strongly in the summer. It rose from around $540 in late June to a high of nearly $810 at the beginning of October, representing an increase of about 50%. Since that high point, the price has fallen by about 11%, and there has also been a shift downward from the previous high on the chart, indicating that momentum is weakening.
The short-term trend has weakened. BNB has fallen below the shorter-term moving averages, which are currently between $733 and $750 and act as resistance. RSI has dropped to around 38, indicating that sellers are in control, but the coin has not yet entered an oversold state.
The current important level is $700. The 100-day moving average, which is also the orange line, is located around that price, at approximately $700, and the current price is only 2.5% higher than it. Further below is the 200-day moving average, around $686, which provides a second layer of support. Both of these moving averages are upward trending and have helped to maintain the trend since August. There is relatively little trading volume data on this chart, so it is difficult to determine how strong the selling pressure is.
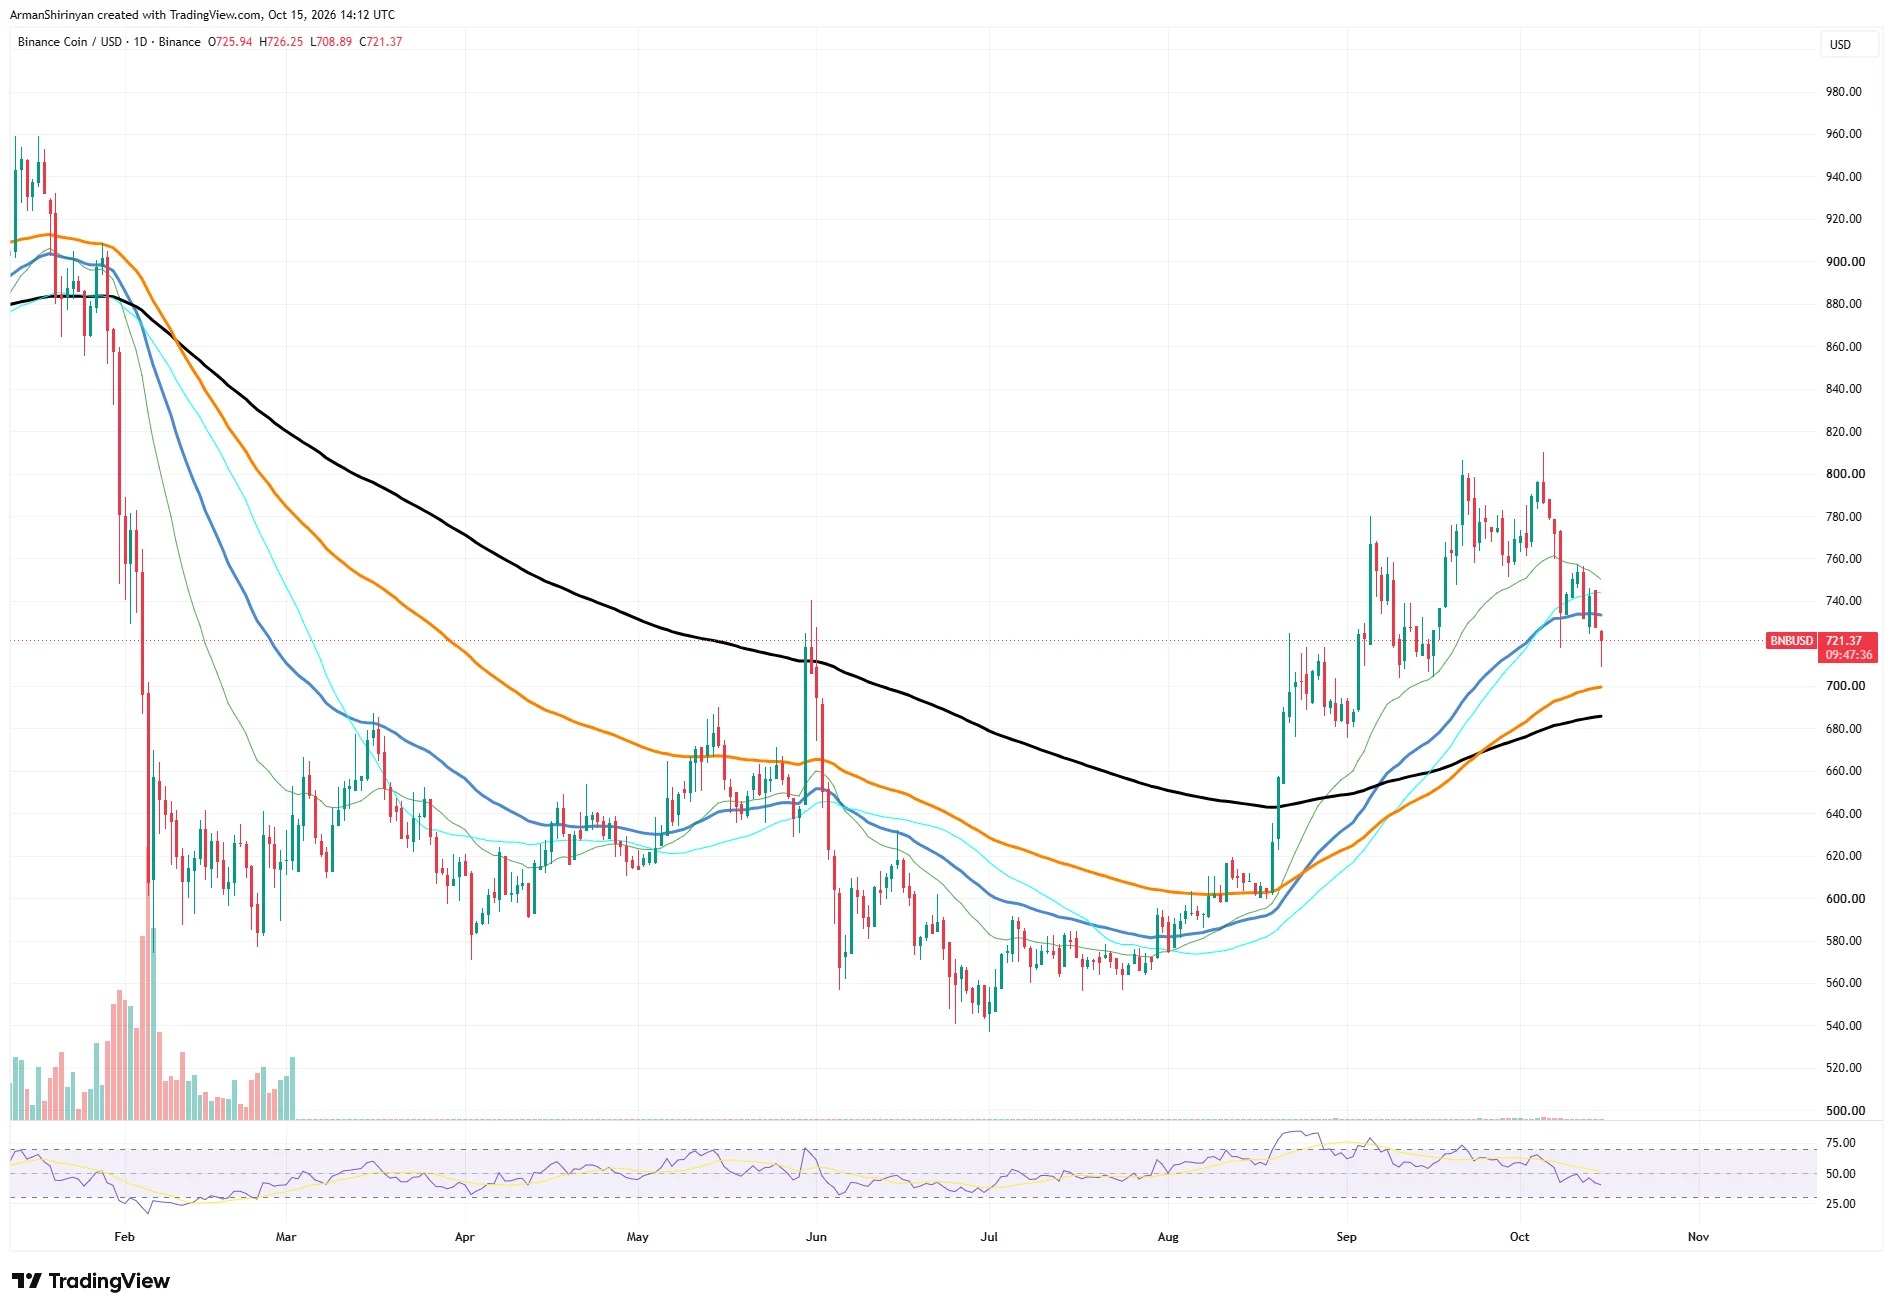
What is clear is the price pattern. The level of $705, near the low in September, was quickly bought back, and today's low of $708.89 fell almost at the same level. If buyers can hold this range again, it may form a solid bottom. A rebound will first require a retest of $735, as the main moving averages are concentrated in this area.
This will indicate that buying at lower levels is still active. If it breaks through $750 further, BNB will return to a healthy upward trend, with $780 becoming the next target, followed by the high of $810.
The risks are on the other side. If the daily closing price falls below $700, it will break the 100-day moving average and could push prices down to $686; if selling accelerates, they might even drop to $660. This would erase most of the gains made in August and September. The bulls need to hold onto $700.
Hyperliquid ( HYPE ) Testing the key support level around $77
Hyperliquid is under pressure. HYPE traded around $77.80, falling by about 4% on the day. The daily chart opened at $80.85 and dropped to a low of $77.56. This decline is part of a larger correction.
HYPE rose from around $51 at the beginning of August to a high of nearly $98 in late September, with a gain of nearly 90% within a few months. Since then, the price has fallen by about 20%, and each rebound has stopped at a lower level than the previous one. The coin has fallen below the 50-day moving average, which is the blue line around $83; it is also below the short-term moving average between $84 and $86, which now acts as resistance. RSI being close to 38 indicates weak momentum, but it is not yet oversold.
The key level is at $77, which is also where the 100-day moving average lies. HYPE is currently only about 1% higher than that level. This line has been supporting the trend since the rebound in August, and a pullback near $75 in mid-September was also held off. Therefore, buyers have a clear defensive range, which is from $75 to $77.
Volume is a positive sign for bulls. During this round of decline, volume has been decreasing, which indicates that sellers have not panicked and sold off in large numbers. However, volume was also low during the rebound, suggesting that buyers have not entered the market in significant volumes either. If the level of $75 is lost at the daily close, the next real support level will be the 200-day moving average around $64.50. This means a further drop of about 17% from the current level, which would put the entire August rebound at risk. Between these levels, there is little that could stop prices from falling.
To recover, HYPE first needs to rise back to $83. Only then can it return above the blue line again, indicating that buying interest at lower levels is active. After that, $86 and $90 will become the next resistance levels. Reaching a new high above $98 currently still seems quite distant. The overall trend is still upward, but in the short term, the dominance lies with the sellers.
Cardano ( ADA ) Sliding towards the 100-day moving average
Cardano is rapidly losing ground. ADA is trading around $0.219, down about 5% for the day. The daily chart opened at $0.2303, and the lowest point during the session was $0.2159 before buyers entered the market.
This round of decline occurred after a period of steady rebound. ADA rose from around $0.14 in June to a high of nearly $0.282 at the beginning of October, an increase of about 100%. Since that high point, it has fallen by about 22%.
The chart shows why the upward trend has stalled. ADA has failed multiple times to close above the 200-day moving average of around $0.241. Each attempt in late September and early October ended with a sharp decline. That line has now become the main resistance for buyers. Today's decline also pushed the price below the 50-day moving average of $0.230 and down to just above the 100-day moving average of around $0.220. This is the last support level in the lower region.
RSI approaching 40 indicates weak momentum, but there is still some room for overselling. Trading volume is at a moderate level. It increased during the sell-off at the beginning of October, but did not reach a panic level. This means that holders have not sold in large quantities, nor have buyers shown strong interest. For a strong rebound to occur, there needs to be an increase in trading volume on green (bullish) days.
Cardano is also following the broader market trend. Bitcoin is approaching $80,000 and is also under pressure, so this seems to be more of a general correction rather than a problem with Cardano itself. If Bitcoin can hold above $80,000, ADA will have a better chance of holding its support level. If the 100-day moving average is breached at the daily close, the next target will be $0.200, which is an integer level that ADA rebounded from in September. Further down, $0.190 would be the next support level, but that could erase most of the recent gains.
For the bulls, the top priority is to regain the level of $0.230. This would allow the price to return above the blue line again and calm market sentiment. A real trend change would require a closing price above $0.241, after which $0.260 would become the next target. For now, the sellers still have the upper hand. ADA needs to hold the range between $0.215 and $0.220 in order to maintain a rebound and avoid a more significant decline.
Success!