SNDK stock, despite showing positive MACD signals on the 15-minute chart, still has a bearish bias on the daily chart. At 10:43 a.m. Eastern Time on Tuesday, the stock traded at $1,453.62, down 2.27% for the day.
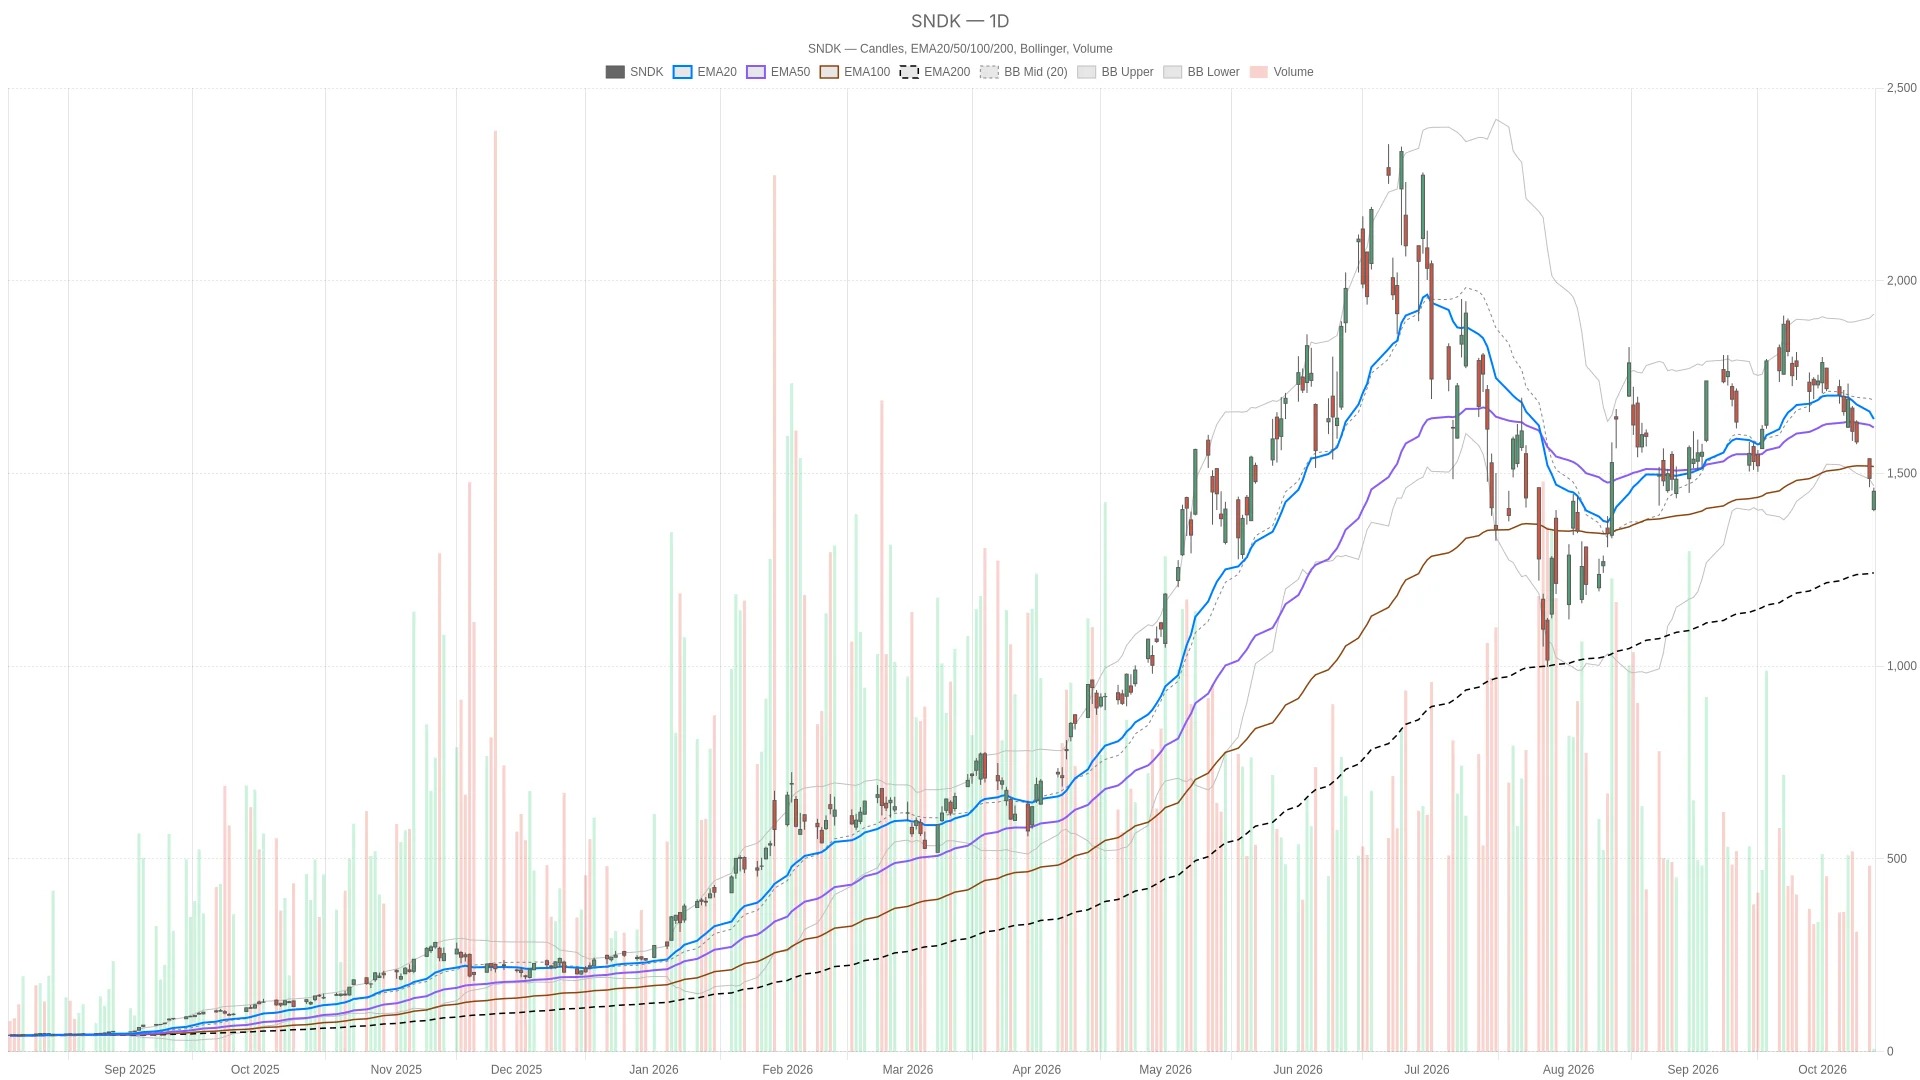
The daily candlestick opened at $1,406.22, hit a low of $1,401.90 during the session, and a high of $1,463.17. The latest price is $1,453.62, with the previous trading day closing at $1,487.33. The hourly chart further reinforces the bearish outlook, making the positive signals from shorter time frames only provide limited counterweight.
Key Points
- At 10:43 a.m. Eastern Time on Tuesday, SNDK traded at $1,453.62, down 2.27% from the previous closing price.
- The daily line RSI14 is at 36.87, which is below the neutral level of 50; the daily line MACD has a value of -38.26.
- The stock price is below the first daily support level of ($S1) $1,454.81, the 15-minute pivot point of $1,454.83, and the lower band of the daily Bollinger Bands at $1,467.33.
- In 15 minutes, the MACD bar value penetrated above the -0.37 level of the previous K-line and reached above the 0 axis, reaching 0.1.
- The hourly moving averages are bearish: the 20-hour EMA is at $1,537.08, which is lower than the 50-hour EMA at $1,610.83, and the latter is in turn lower than the 200-hour EMA at $1,648.43.
SNDK Stocks: The main resistance level on the daily chart is defined as follows
The daily chart structure of SNDK stock is bearish. The stock price is below the 20-day EMA level of $1,640.98 and the 50-day EMA level of $1,619.08, but it is still higher than the 200-day EMA level of $1,239.71. This arrangement is not a completely bearish structure, but the two nearest moving averages form resistance above.
At the same time, the daily line RSI14 is at 36.87, which is below the neutral level of 50, but it has not yet entered the oversold area. The daily line MACD is at -21.31, which is below its signal line of 16.96, and the value of the MACD column is negative, at -38.26. Both of these indicators suggest a bearish trend on the daily chart, rather than a bullish interpretation.
The stock price is also below the lower band of the daily Bollinger Bands at $1,467.33. The middle band at $1,690.37 and the upper band at $1,913.40 are both above it, which means that the price is outside the lower boundary of the Bollinger Bands. Therefore, volatility becomes particularly important when evaluating nearby key levels.
It is worth noting that the stock price is slightly below the first support level on the daily chart ( S1 ) at $1,454.81. The daily pivot point of $1,496.95 and the first resistance level ( R1 ) at $1,529.48 are still above. These levels come from the previous complete daily candlestick chart and are still applicable to the current trading session.
Weak hourly charts limit bullish signals for short-term trading

The hourly structure remains largely empty.
The hourly moving average confirms the bearish outlook of the daily chart. The stock price is below $1,537.08, which is the 20-hour EMA, and the 20-hour EMA is in turn below $1,610.83, which is the 50-hour EMA. Furthermore, the 50-hour EMA is below $1,648.43, which is the 200-hour EMA. This constitutes a complete bearish pattern at the hourly level.
However, the hourly momentum indicators are not entirely bearish. The value of RSI14 is 23.05, which is in the oversold area. The value of MACD has risen from -6.76 on the previous hourly candlestick to -6.01, although it is still negative. The value of MACD is -53.96, which is still below the signal line of -47.95; therefore, this improvement is not sufficient to establish a bullish momentum.
At the same time, the stock price is above the hourly pivot point of $1,439.13 and the lower Bollinger Band of $1,418.34, but it is still below the first hourly resistance level ( R1 ) of $1,476.37 and the middle Bollinger Band of $1,544.90. The hourly ATR14 is at $27.58, providing a volatility context for these intraday levels.
15-minute charts provide limited positive MACD signals
From an execution perspective, the value of the 15-minute MACD indicator crossed above the zero line from -0.37 on the previous candlestick to 0.1. The MACD line is at -18.67, which is higher than the signal line of -18.77. Nevertheless, the RSI14 indicator is at 36.49, which is below 50, and the stock price is still below all three 15-minute moving averages. The 20-period EMA indicator is at $1,473.77, the 50-period EMA indicator is at $1,514.62, and the 200-period EMA indicator is at $1,622.09.
The 15-minute pivot point of $1,454.83 constitutes the recent upper resistance level, followed by the first resistance level ( R1 ) at $1,460.67. Below the current price, the first support level ( S1 ) is at $1,446.50, and the lower Bollinger Band is at $1,436.30. The middle band at $1,473.92 is also above this level, with ATR14 set at $1,556. Therefore, this positive golden cross ( MACD ) conflicts with the broader bearish structure, but it is not sufficient to overturn the latter.
Competition concerns form the backdrop of the news narrative.
A report published by Yahoo Finance before the opening on Tuesday linked the decline in the stock price of Sandisk to concerns about the progress of China's storage chip industry. According to another report released by Yahoo Finance on Monday, October 12th, ChangXin Memory (CXMT) plans to launch a new DRAM product targeting the AI market by the end of 2026. These reports provide a competitive context, but they do not confirm that they are the cause of the current market fluctuations.
Bullish and bearish scenarios
To be bullish, one needs to re-cross the key resistance levels again.
A bullish scenario requires the stock price to re-establish above the daily level of $1,454.81 (S1) and the 15-minute pivot point of $1,454.83. If it further breaks through the 15-minute level of $1,460.67 (R1) and the lower band of the daily Bollinger Bands at $1,467.33, this judgment will be strengthened. Above these levels, the hourly pivot point is at $1,476.37 ($BJWKEEP_00003__), followed by the daily pivot point of $1,496.95 and the daily level of $1,529.48 ($BJWKEEP_00004__). Nevertheless, the daily moving average will still pose significant resistance above these levels.
Bearish scenarios point to even lower support levels.
On the contrary, if it falls below $1,446.50, which is the 15-minute S1, it will weaken the short-term bullish logic. The next reference levels are the hourly pivot point of $1,439.13 and the lower band of the 15-minute Bollinger Bands at $1,436.30. Further down are the lower band of the hourly Bollinger Bands at $1,418.34, the $1,415.10 level of the hourly S1, and the low of this trading session at $1,401.90. If it falls below this low, it will negate the bullish scenario that is based on holding the current session range.
Overall, SNDK is currently slightly below the daily S1 and the 15-minute pivot point, with the lower band of the daily Bollinger Bands also located above it. The daily ATR14 is at $95.89, indicating that volatility remains a key factor in the current pattern. The question that remains to be seen is whether the positive signals from the 15-minute MACD can be transformed into upward momentum to break through resistance, despite the generally bearish trends on the daily and hourly timeframes.
Frequently Asked Questions
What is the daily technical outlook for SNDK stock?
The daily chart indicates a bearish trend. The stock price is below the 20-day EMA of $1,640.98 and the 50-day EMA of $1,619.08, but it is still above the 200-day EMA of $1,239.71. The daily RSI14 is 36.87, and the MACD column value is negative, at -38.26, which both support a bearish outlook.
What are the key resistance levels for SNDK stock?
The recent resistance levels are $1,454.81 at the daily S1 and $1,454.83 at the 15-minute pivot point. Above that are $1,460.67 at the 15-minute R1, $1,467.33 at the lower band of the daily Bollinger Bands, and $1,476.37 at the hourly R1. Even higher levels include $1,496.95 at the daily pivot point and $1,529.48 at the daily R1.
Has the 15-minute MACD signal changed the bearish outlook?
In the 15-minute time frame, the value of MACD has crossed above the zero line to 0.1, and the value of MACD at -18.67 is higher than the signal line of -18.77. However, the value of RSI14 at 15 minutes is 36.49, which is below 50, and the stock price is still lower than all three 15-minute EMA values. Therefore, this positive MACD crossover conflicts with the broader bearish trend, but it has not managed to reverse that trend.
SNDK What are the current support levels for this stock?
Below the current price, the 15-minute S1 level is at $1,446.50. The hourly pivot point is at $1,439.13, and the lower band of the 15-minute Bollinger Bands is at $1,436.30. Even lower levels include the hourly Bollinger Bands lower band at $1,418.34, the S1 level at $1,415.10, and the lowest point of this trading session at $1,401.90.
Neither Cryptonomist nor the author holds any positions in the financial instruments mentioned in this text, nor have they received any compensation from the companies reported.
This article was completed with the assistance of artificial intelligence and has been reviewed by an editorial team.