

NEAR, XRP, SHIB and Bitcoin Price Analysis for October 10: The Crypto Market is Declining
The rebound of NEAR paused below the resistance level of $5.60.
XRP Price Testing of the 200-Day Moving Average
SHIB The seller pushed the price below the 200-day moving average.
Healthy pullback in an uptrend
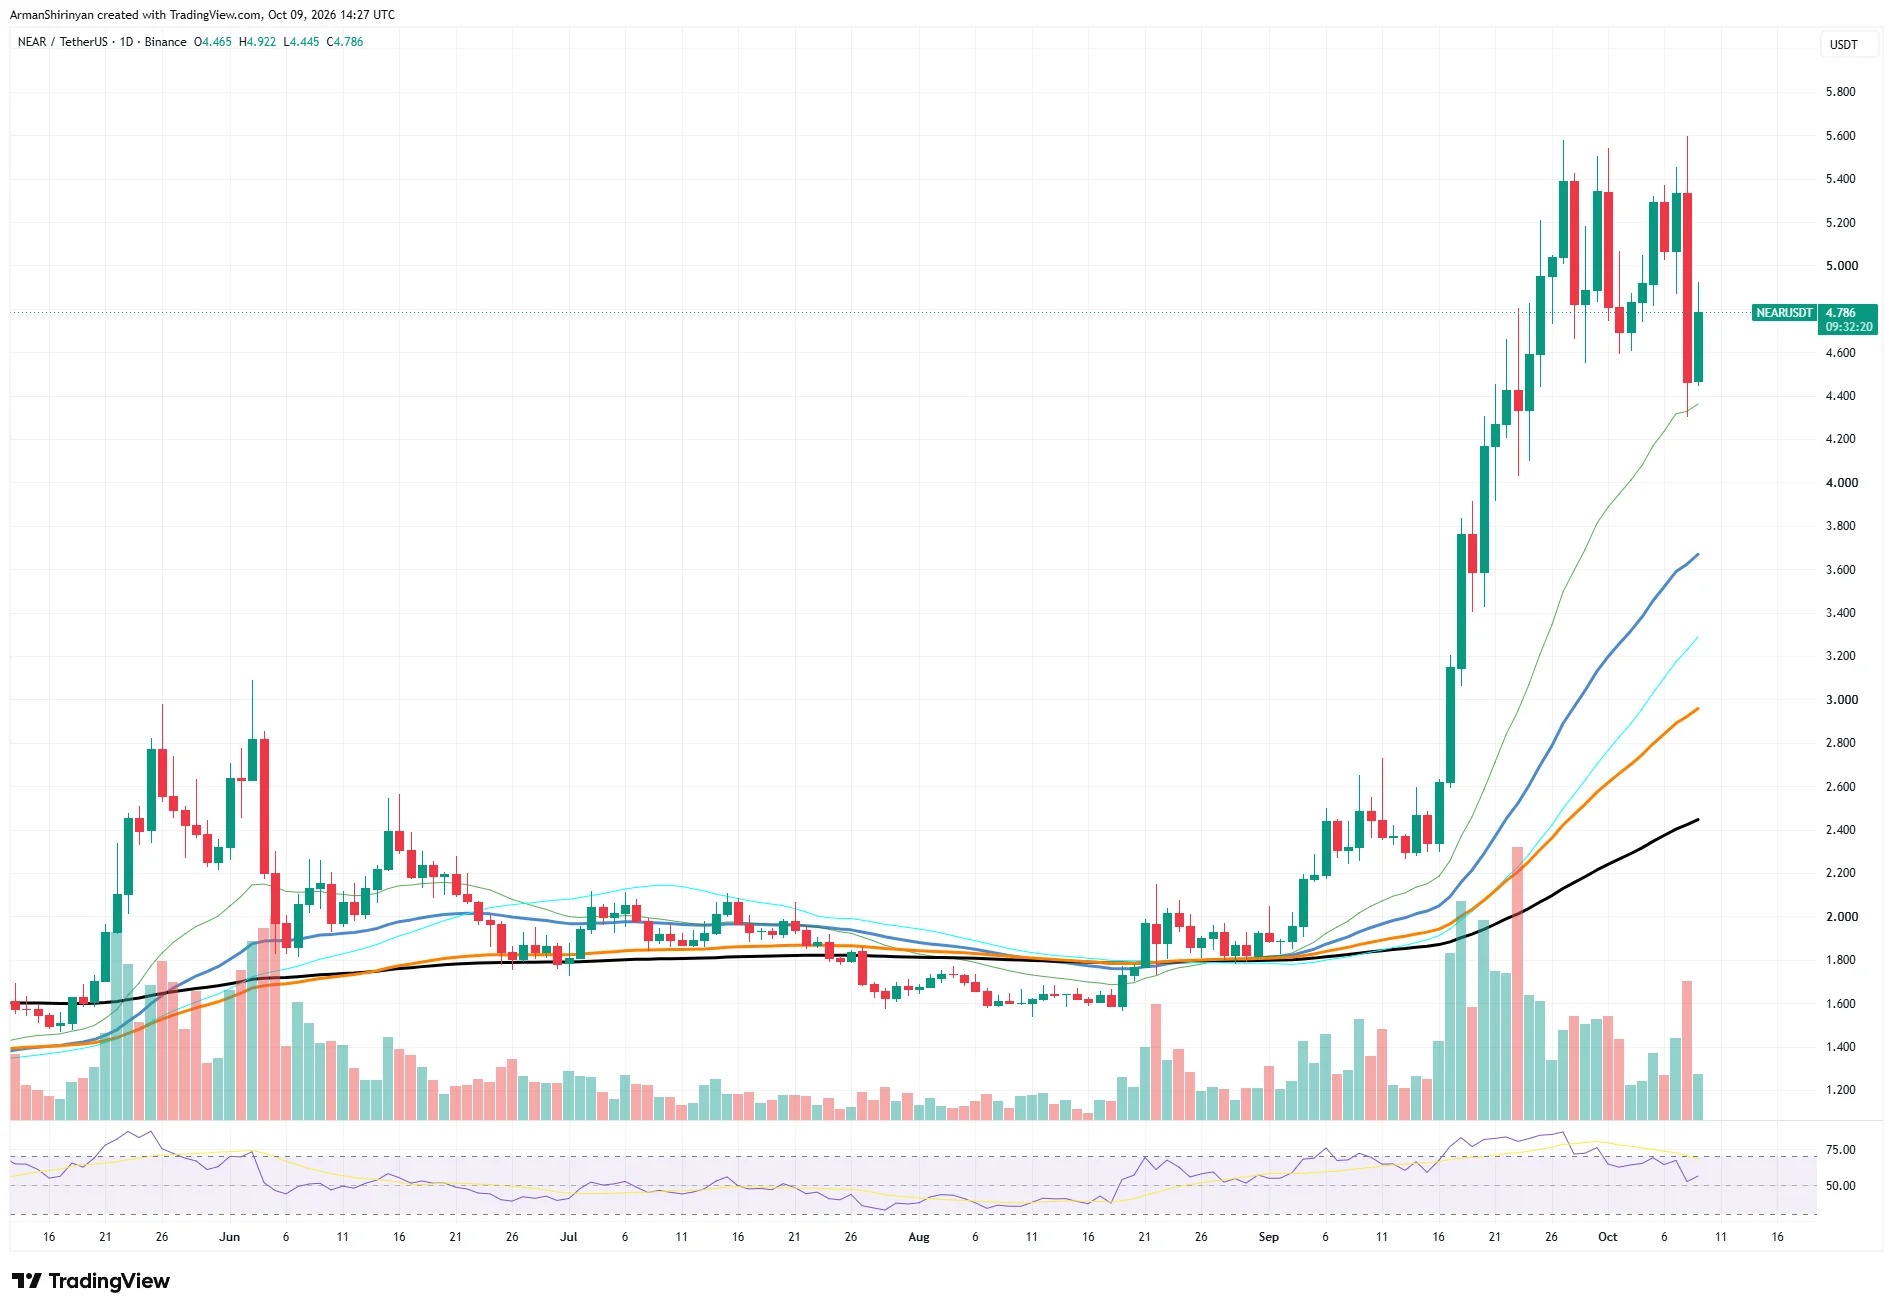
NEAR Protocol ( NEAR ): The trading price is close to $4.79, below the major resistance level of $5.60, with $4.35 being a key support level. RSI is in the mid-50s range, still leaving room for upward movement, but first, it needs to close above $5.00.
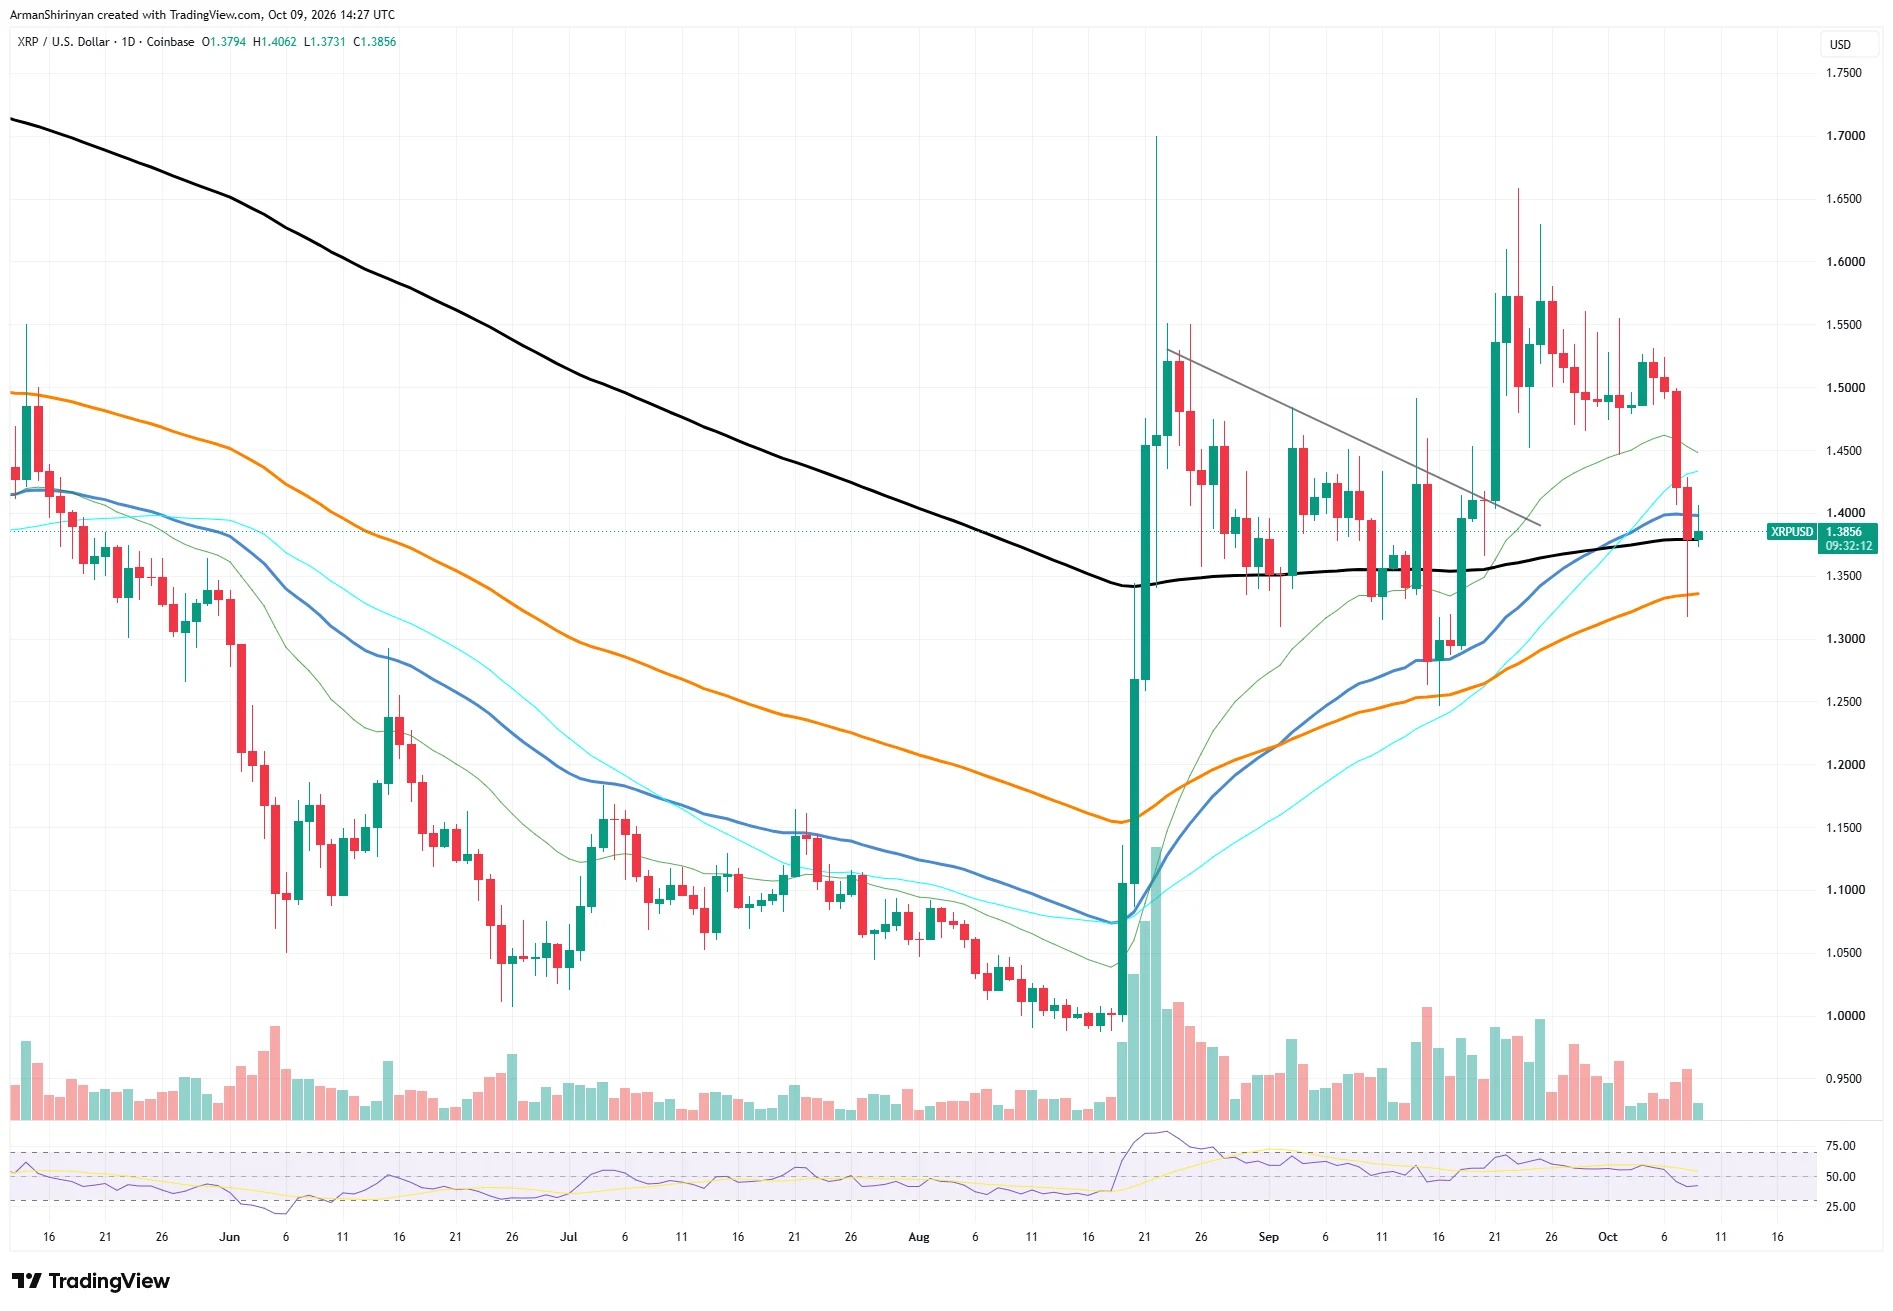
XRP ( XRP ): The trading price is close to $1.38, above the 200-day moving average. RSI is near 42, with relatively low trading volume, indicating that the market is hesitant. The range between $1.33 and $1.40 will determine the next trend.
Shiba Inu ( SHIB ): After falling below the 200-day moving average, the trading price approached $0.00000536. The $0.00000529 level near the 100-day moving average serves as a key support, and SHIB is likely to continue to fluctuate between $0.00000510 and $0.00000565.
Bitcoin ( BTC ): After rebounding from the 20-day moving average, the trading price is close to $82,949. The trend remains bullish; $87,000 is the resistance level, while $80,000 is the support level that needs attention first.
The rebound of NEAR paused below the resistance level of $5.60.
After several days of fluctuations, the trading price approached $4.79. The coin rose from around $1.60 in late August to nearly $5.60 in late September, representing a gain of over 250%. Since then, the price has failed to close above $5.60 on three occasions, making this level the main resistance.
RSI has fallen back from the overbought area and is currently in the mid-50s range. This cooling of the current rebound also leaves room for the next wave of upward movement. Today's rebound saw a decrease in trading volume, so buyers still need to prove that they have returned.
The larger picture is still favorable for the bulls. All moving averages are upward, and they are in the correct order. The price is far above all the moving averages, so there is still plenty of room for a pullback before the trend is broken. If it closes above $5.60, it will set a new high. If $4.35 is lost, it is expected to fall towards $3.80, followed by the $3.60 area.
What will happen next: The first target is $5.00. If the daily chart closes above this level, $5.60 will come back into focus. Before NEAR closes above $5.00, prices are likely to range between $4.35 and $5.60.
XRP Price Testing of the 200-Day Moving Average
After pulling back from the $1.50 range, the trading price approached $1.38. The coin is currently above the 200-day moving average, which is located around $1.38. This is the most important level on the chart. How XRP closes here will determine the next trend.
This round of decline was quite rapid. A large negative candlestick penetrated the 20-day and 50-day moving averages, followed by a long lower shadow that pulled the price down to $1.32, after which buyers pushed the price back up again. That lower shadow indicates that there is demand around the 100-day moving average, at around $1.335. Previously, XRP broke through a downward trend line in September and rose to $1.65. That rally was strong, but the price failed to hold above $1.55, and now most of that gain has been given back.
Above the price level, several moving averages are densely distributed between $1.40 and $1.46, and they will act as resistance. XRP needs to close above $1.46 on a daily basis to demonstrate true strength. If XRP can hold the 200-day moving average and close above $1.40, there is a possibility of reaching $1.45, followed by $1.50. If this level is lost, the next support level is $1.33, followed by the $1.25 area, where prices rebounded in mid-September. If it closes below $1.25, the trend will turn bearish.
Currently, the range of $1.33 to $1.40 determines the next trend.
SHIB The seller pushed the price below the 200-day moving average.
After a sudden drop, the trading price approached $0.00000536. The price fell from the $0.00000600 range and broke below the 200-day moving average, which is located around $0.00000565. This is the main reason for the decline. SHIB failed to hold this line, and sellers quickly took over the market.
The decline stopped near the orange line, which is also the 100-day moving average at around $0.00000529. The price once dropped to $0.00000510, but buyers then pushed it back up. Today's K-line is a positive line, indicating that there is still some demand at that level. The 100-day moving average is now a key support level.
RSI is approaching 45, which is considered neutral with a slight weakness. The low trading volume during the rebound indicates that buyers currently do not have strong confidence. This decline was accompanied by higher trading volumes, which has given sellers a temporary advantage.
Above the price level, there is a relatively dense resistance zone. The 20-day and 50-day moving averages are around $0.00000545 to $0.00000548, while the 200-day moving average is at $0.00000565. These levels will slow down any rebound. SHIB requires a daily close above $0.00000565 to show true strength. If SHIB can hold at $0.00000529 and break above $0.00000548, then there is a higher possibility of testing $0.00000565. A close above that level could open up space towards $0.00000600.
If the support level of $0.00000529 is breached, the next support level will be $0.00000500, where the price rebounded in mid-September. If the price closes below $0.00000500, then the $0.00000470 range will come into focus.
Currently, SHIB is still within a narrow range between $0.00000510 and $0.00000565.
Healthy pullback in an uptrend
After falling back from the $87,000 range, Bitcoin's trading price approached $82,949. The price once dropped to $80,300, then rebounded, and closed higher today. The rebound occurred near the 20-day moving average, which is the light blue line around $80,700. This is a positive sign in an upward trend.
The 50-day moving average is near $79,800, the 100-day moving average is near $75,900, and the 200-day moving average is near $75,200. All major moving averages are upward, and the price is far above them, so the trend is not currently under threat.
The bigger picture remains bullish. Since August, BTC has risen from $63,000 to $87,000. If it closes above $87,000, it will open the way to a new high near $90,000.
BTC has failed to hold above $87,000 twice, and this level has now become a strong resistance. If $80,000 is lost, the next support level will be the 50-day moving average near $79,800, followed by $77,000. If it closes below $75,000, it will break below both the 100-day and 200-day moving averages, indicating a weakening trend.
The first target is $85,000. Closing above that level would bring $87,000 back into focus. Before the $75,000 support level is breached, buyers still hold the upper hand, and a pullback to around $80,000 would seem like a buying opportunity.