

After a sharp drop to around $2,400, the price of Ethereum rebounded to around $2,493, but its daily Supertrend has turned bearish, and the 4-hour chart still shows negative capital flow.
After recovering from a sharp drop from near $2,400, Ethereum is trading around $2,493.
The daily resistance level Supertrend is at $2,764, which is higher than the current price of Ethereum.
On the 4-hour chart, the middle band of the Bollinger Bands is at $2,569, which serves as the resistance for the next rebound.
US spot Ethereum ETF recorded a net outflow of $486.1 million over four trading days.
Ethereum price struggles to regain $2,500
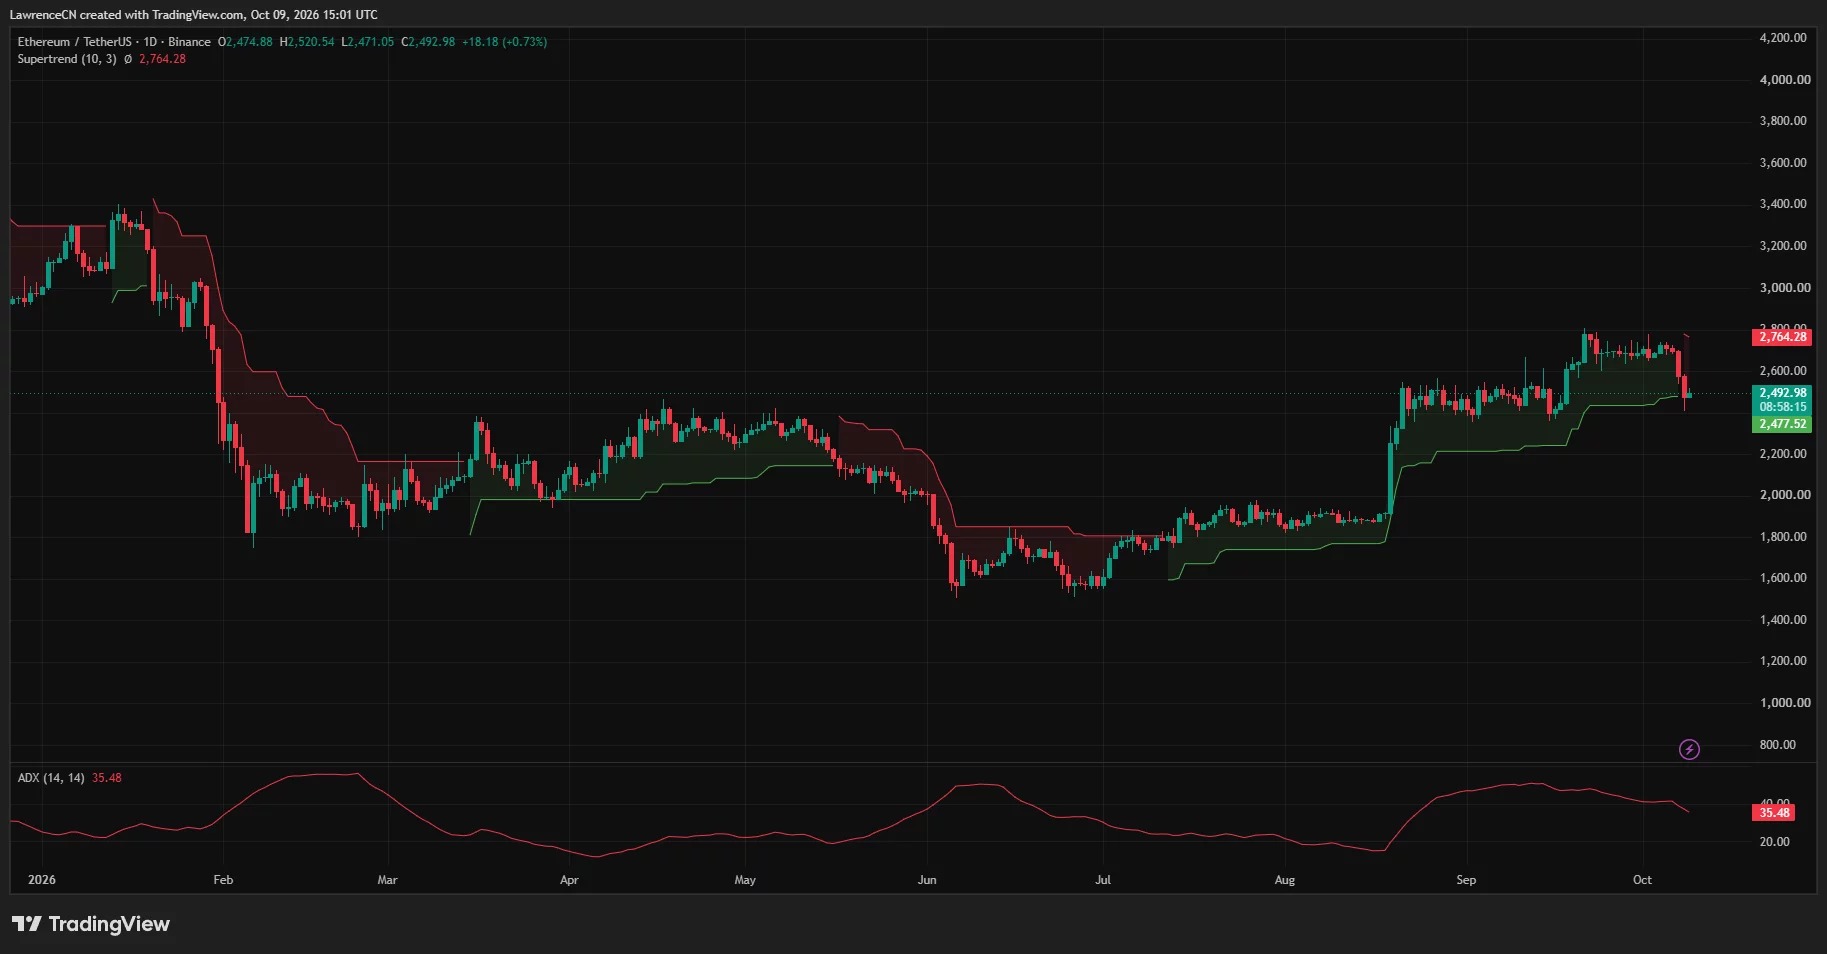
The Binance ETH / USDT daily chart on TradingView shows that on October 9th, Ethereum traded at $2492.98, representing a 0.73% increase from the previous day. The price range for the day was between $2471.05 and $2520.54. Although the price briefly exceeded $2500 during the session, ETH still closed below that level.
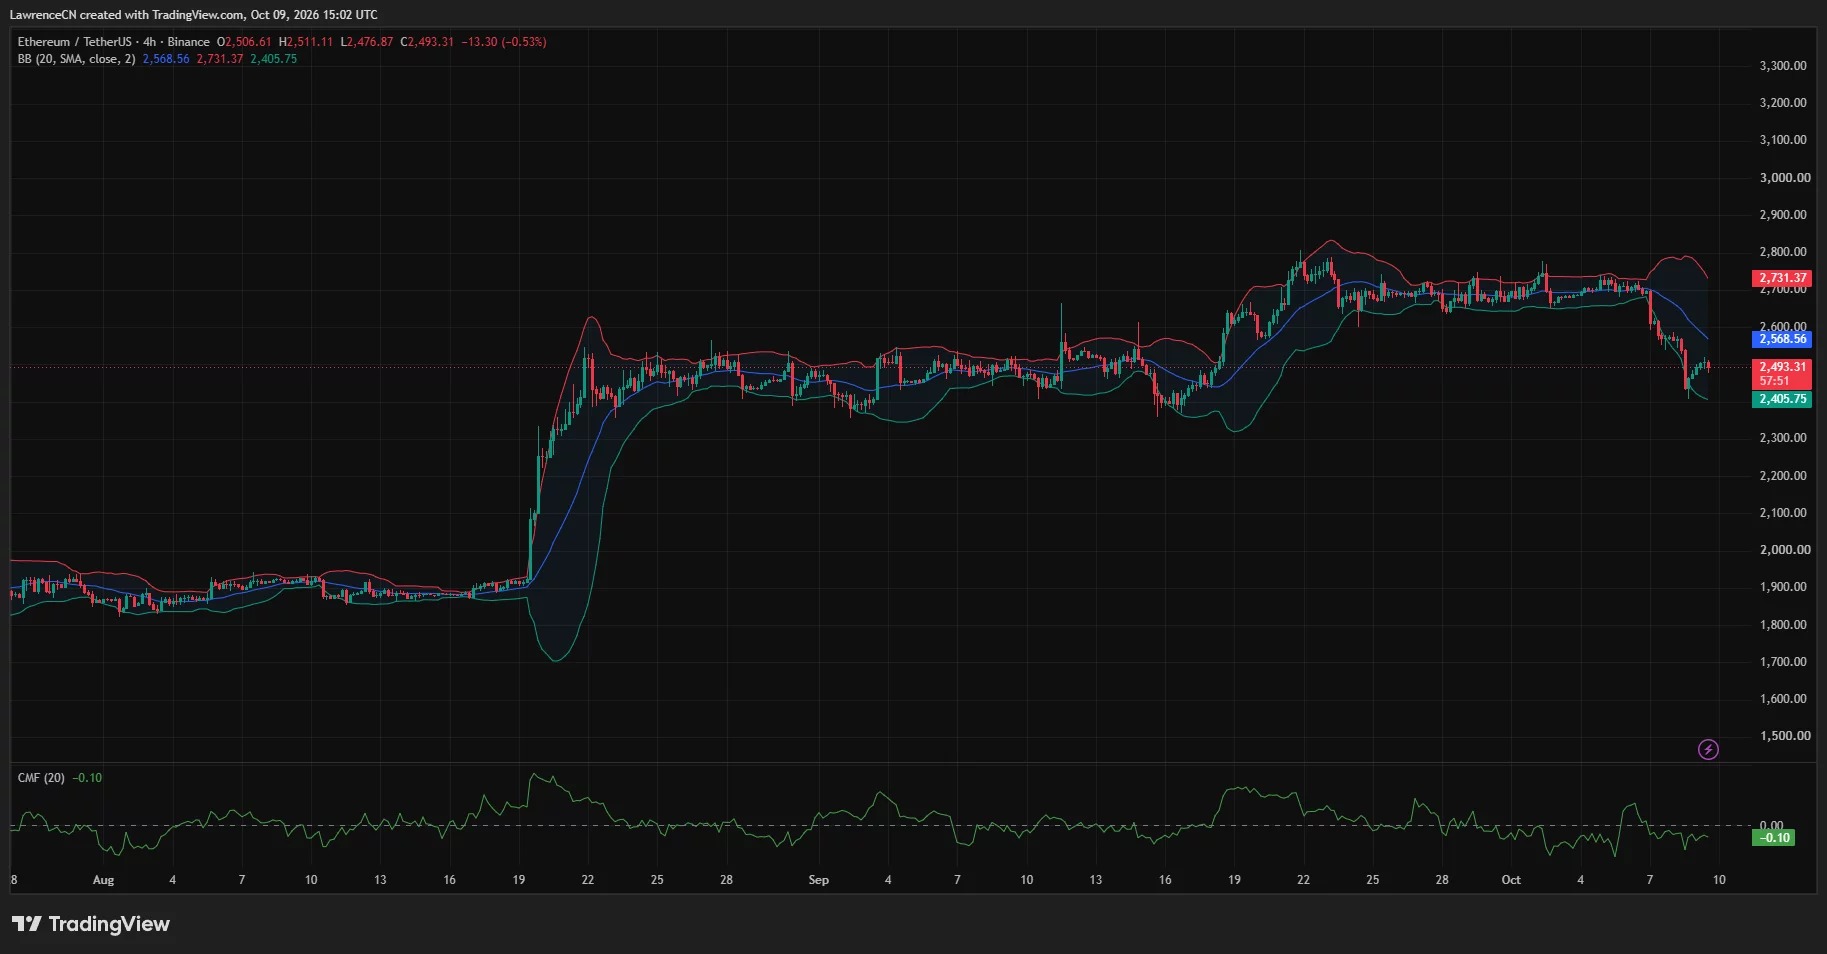
On the 4-hour chart of TradingView, ETH traded at $2,493.31, representing a decline of 0.53% during the observed period. Its rebound from recent lows has stalled around $2,500, and the latest candlestick still lies below the downward moving average on the chart.
Analyst Ella identified $2,500 as the level that buyers need to reclaim first in a post on October 9th. She stated that Ethereum fell from around $2,700 to a lower shadow near $2,400, with a decline of nearly 11%, and selling pressure accelerated at the end of trading.
Ella indicates that if the price can rebound to $2,500 again, it might alleviate some of the panic; however, if this level cannot be regained, any subsequent rebound will face vulnerability. Her judgment focuses on whether Ethereum will be able to hold this integer level after a brief drop.
Daily chart Supertrend has turned bearish.
It is located above ETH, which indicates that the daily trend signal has turned bearish. Calculated at around $2,493, Ethereum is nearly 10% below the Supertrend level, and there is still a significant gap between the potential rebound and a reversal of this signal.
The previous green Supertrend line closed at around $2,477.52, close to the current price. Ethereum's previous sharp decline caused the lower shadow line to fall below that area before it rebounded, while the newly displayed red line has set a higher resistance level.
The TradingView Daily Average Trend Index (ADX) is 35.48. This reading is still above the commonly used threshold of 25 for a trend to be established, but it has fallen from its peak in September.
ADX measures the strength of a trend, not its direction. In Ethereum's current structure, a bearish trend is indicated by changes in Supertrend and a price break below a certain level, while a decline in ADX suggests that the measured trend strength has weakened compared to before.
The daily chart also shows that the previous trading range of $2,650 to $2,750 is above the current market level. If there is a rebound back to that area, more of the recent decline will be made up for, but ETH still needs to break through the resistance level of nearly $2,764 ($Supertrend) in order to reverse the bearish outlook for this indicator.
The 4-hour chart shows that $2,569 is a key level before a stronger rebound.
Ethereum's 4-hour Bollinger Bands show a middle band of $2,568.56, an upper band of $2,731.37, and a lower band of $2,405.75. After rebounding from near the lower band, ETH is still in the lower half of that range.
The mid-track is about 3% higher than the current displayed price. Therefore, if it breaks above $2,500, it will first surpass the nearest integer level, and the 20-period moving average of around $2,569 will become the next technical test point.
During the selling process, the Bollinger Bands clearly expanded, with the upper band rising and the lower band falling. On the chart, this expansion coincided with Ethereum breaking below its previous consolidation range of around $2700.
The 4-hour Chaikin Money Flow reading is -0.10, which is in the negative range. This indicator below zero indicates that there was selling pressure during its statistical period, even though Ethereum has rebounded from its lows.
Overall, the price being below the middle band of the Bollinger Bands and CMF being negative indicate that the short-term rebound has not yet received clear bullish confirmation. If it can remain above $2,569, and at the same time CMF returns above zero, it will strengthen the case for a rebound within this time frame.
On the downside, the lower band of the Bollinger Bands, which is around $2,406, overlaps with the recent low of around $2,400. If it falls below this area, Ethereum will lose both its latest low and the boundary of the bands shown on the chart.
ETF Redemption continues, the清算 intensive area is still above.
Farside Investors data shows that on October 6, there was a net outflow of $201.9 million in spot Ethereum from the United States, and on October 7, another $160.9 million flowed out. The total net outflow for the two days was $362.8 million.
The same data also shows that on October 8th, there was a further net outflow of 72.5 million US dollars. If we add the 50.8 million US dollars that flowed out on October 5th, the cumulative net redemptions over four trading days reach 486.1 million US dollars, extending the consecutive days of capital outflows from these funds to eight trading days.
The one-week Ethereum heat map of CoinGlass shows that the current brightest and most concentrated area is around $2,635 to $2,640. There are also dense zones near $2,610, as well as in the range of approximately $2,740 to $2,760, all of which are above the current market price.
Below ETH, the heat map indicates that smaller dense areas are located around $2450 to $2460 and near $2400, with another zone near $2380. These levels are below the rebound and also close to the regions reached during the deepest point of this round of sharp declines.
Another analyst who publishes weekly assessments under the name Wealthmanager has presented a more long-term bullish scenario. This analyst described an inverted head and shoulders pattern, a reclaimed neckline, and an improved RSI, stating that if the backtesting is successful, prices could potentially reach between $3,200 and $4,000.
However, this prediction still depends on whether the weekly backtest can hold. On a shorter time frame of TradingView, Ethereum still needs to face levels of $2500 and $2569 before it can return to the aforementioned trading range and approach the daily resistance level of $2764 ($BJWKEEP_00002__).
Disclosure: This article does not constitute investment advice. The content and materials on this page are for educational purposes only.