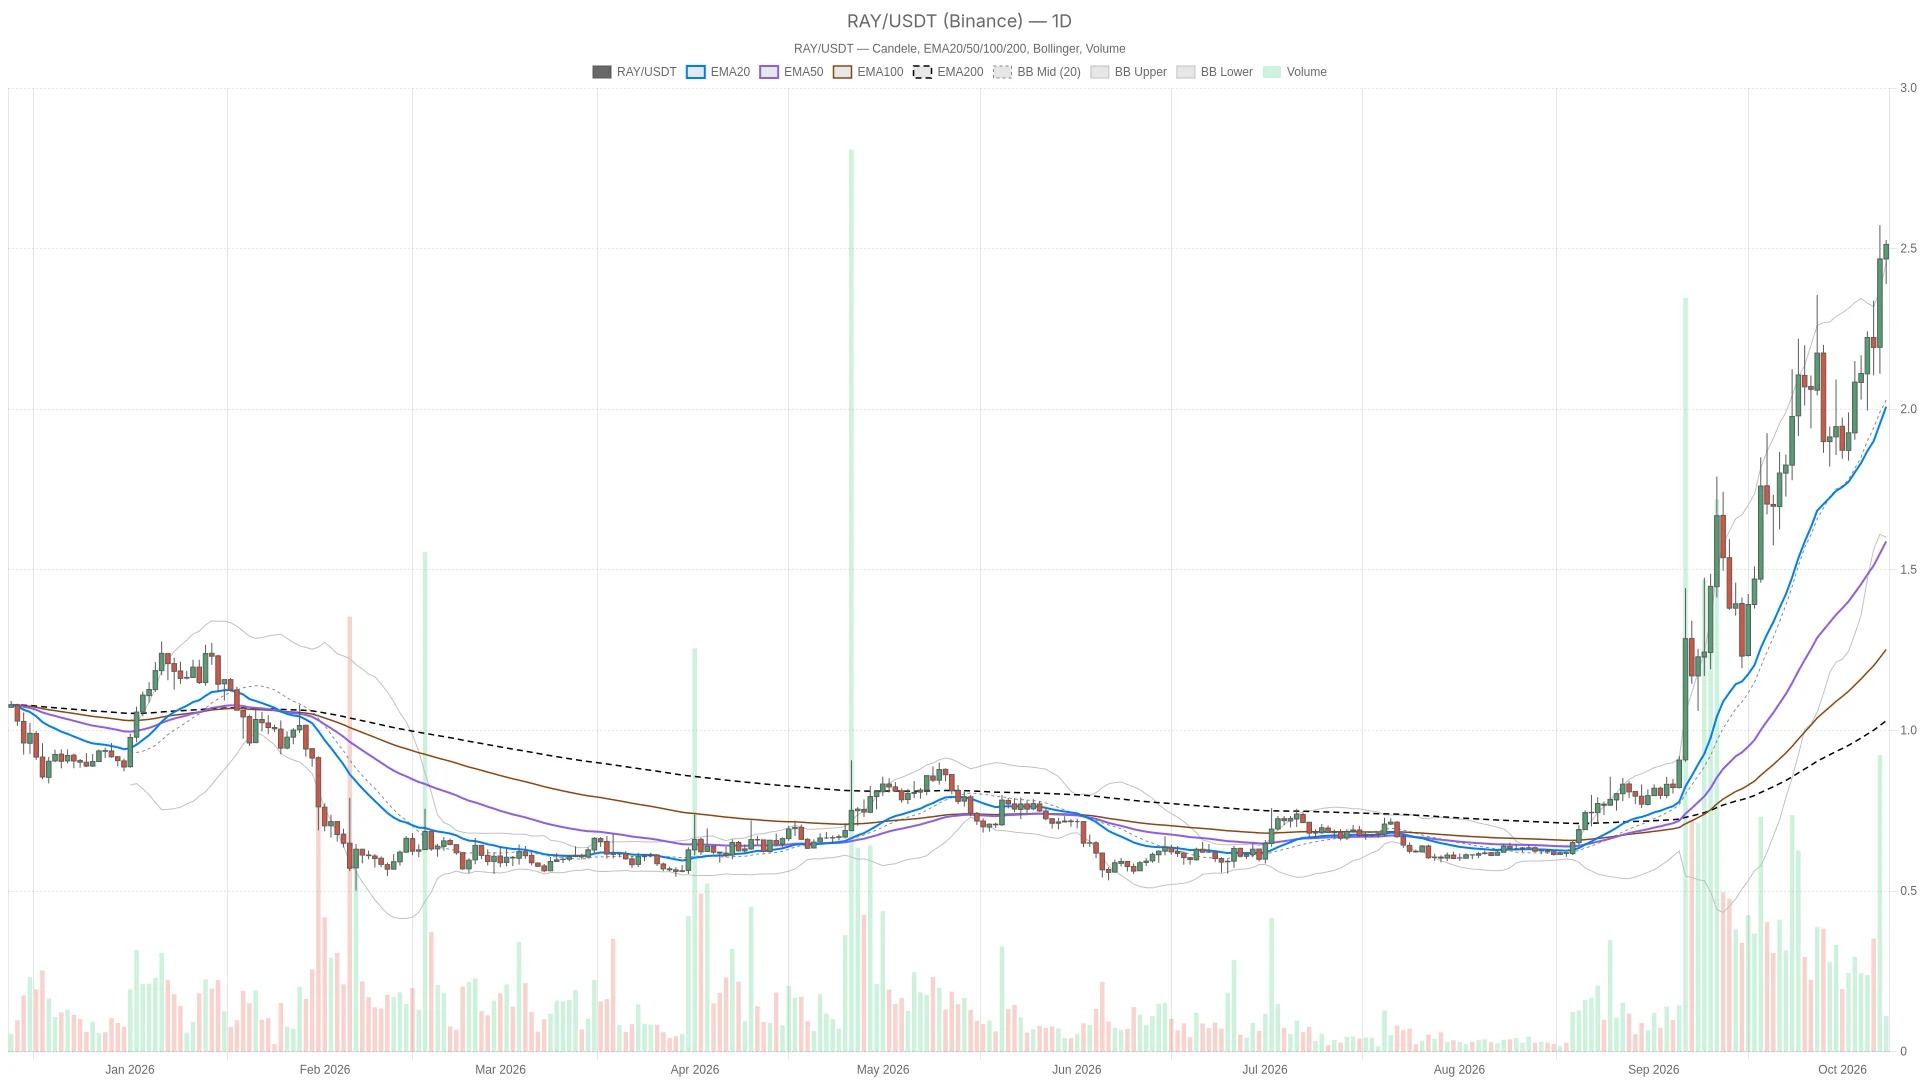
On October 8, 2026, the price of Raydium was reported at $2.51 on Binance. The daily chart structure remains bullish above all three moving averages. The upward trend is still dominant, but the recovery of hourly-level momentum has not yet been completed, so the breakout has not been confirmed yet.
Key Points
- Raydium is reporting $2.51, with the daily moving averages in a bullish arrangement: EMA20 at $1.95, EMA50 at $1.55, and EMA200 at $1.02.
- The daily line RSI is at 74.5, indicating an overbought area; the hourly line MACD bar chart is still negative, but it is steadily narrowing.
- The hourly chart R1 is at $2.53, which is the current breakout trigger level; the pivot point of $2.49 on the hourly chart is a key support level that needs to be held.
Raydium The daily price trend is strong, but the confirmation at the hourly level is not yet complete.
The daily chart defines the main scenario as bullish, but the hourly chart has not yet confirmed this trend with positive momentum. The most recent daily candlestick closed at $2.47, and the real-time daily price is at $2.51. The daily MACD bar chart is positive, supporting a continuation of the upward trend; however, the hourly bar chart remains negative, although it has been improving in the last three completed readings. Therefore, the direction and momentum are not completely aligned.
The 15-minute chart provides more reference at the execution level, rather than an independent macro signal. The real-time price is also at $2.51. The MACD bar chart shows a positive trend and is expanding. This short-term strong support is testing the resistance level again, but this alone is not sufficient to resolve the discrepancy between the daily momentum and the still-negative hourly bar chart.
Moving average alignment supports trends, while the extension of Bollinger Bands increases the risk of pullbacks.
Moving averages across all time frames are arranged in a bullish manner, but the price is above the upper band of the daily Bollinger Bands, which indicates an increased risk of pullbacks. The candlestick data for Binance shows that the price is higher than $1.95 for the daily EMA20, $1.55 for EMA50, and $1.02 for EMA200; the moving averages maintain a textbook-style bullish sequence.
The hourly structure is also consistent: prices above EMA20 at $2.42, EMA50 at $2.33, and EMA200 at $2.15 are also arranged in a bullish pattern. On the 15-minute chart, prices are above EMA20 at $2.47, EMA50 at $2.45, and EMA200 at $2.33, with the same arrangement. The consistency across time frames makes the trend foundation more solid than mere momentum.
The Bollinger Bands are more stretched. The daily price is above the upper band of the Bollinger Bands at $2.37, with the middle band at $1.99 and the lower band at $1.61. The upper band is now below the current price level and can serve as a potential support level, rather than a resistance level above it. If the price falls back to this level, it would indicate a mean reversion within the overall bullish trend.
The hourly price is still within the range of $2.38 to $2.54, which is higher than the midline of $2.46. The 15-minute Bollinger Bands range is from $2.40 to $2.52, with the midline at $2.46, and the price is close to the upper edge. Both short-term periods indicate that the current upward trend is closer to the upper boundary of the range rather than the middle.
The daily line ATR is at $0.22, the hourly line is at $0.07, and the 15-minute chart shows $0.03. These readings describe the range of K-line fluctuations, not the direction. Therefore, the nearby intraday levels need to be confirmed by completed K-lines, and cannot be determined based on just brief touches.
Overbought daily chart RSI and the hourly chart under repair MACD
The daily line RSI is at 74.5, indicating overbought conditions; meanwhile, although the hourly line MACD bar chart is still negative, it is steadily narrowing. The daily line RSI continues to rise among the given completed readings and has firmly entered the overbought range. The hourly line RSI has risen to 62.6, the 15-minute line RSI is at 62.1, and the recent sequence shows a mixed performance. Strength can be seen in all time frames, but only the daily line reading is in an overbought state, with the shorter time frames not yet showing the same degree of expansion.
On the daily chart MACD, it has turned into a positive bar chart in the last three completed candlesticks. The hourly bar chart is still negative, but the negative range is narrowing, indicating that the downward momentum is weakening, although it has not yet disappeared. The 15-minute bar chart is positive and its range is expanding. Overall, these indicators support the continuation of an upward trend, but the confirmation at the hourly level has not yet been established.
Hourly chart: Resistance at $2.53 and support at $2.49 define the scenario
To confirm a breakout, it is necessary for the hourly chart to close above $2.53; if it closes below $2.49, then that would open up room for a pullback. The nearest upper level is $2.53 on the hourly chart at R1, followed by the upper band of the Bollinger Bands at $2.54. The nearest support level is $2.49, which is the pivot point on the hourly chart. The most recent completed hourly candlestick closed at $2.50, which is between these two levels, so neither of the triggering conditions has been met yet.
Bullish scenario: If the hourly chart closes above $2.53, which is the level marked as R1, a partial breakout will be confirmed. If the price continues to rise, the daily chart resistance level of $2.66, marked as R1, will be the next hurdle. If the hourly chart closes below $2.49, this bullish scenario will not hold. The most likely risk of a false breakout is when the price briefly breaks above the hourly level of R1 but fails to hold that level on the completed K-line chart. The daily chart, already in an overbought state as indicated by RSI, also increases this risk.
Bearish scenario: If the hourly chart closes below the hourly pivot point of $2.49, it will trigger a short-term pullback. The initial targets are the middle band of the hourly Bollinger Bands at $2.46 and the S1 level at $2.45. If there is further decline, the daily pivot point of $2.38 will come into view, with the upper band of the daily Bollinger Bands at $2.37 and the S1 level at $2.19 following. If the hourly chart closes above $2.53, this bearish setup will become invalid. The main risk of false signals lies in a temporary drop below the pivot point within an otherwise aligned bullish trend, rather than the beginning of a reversal on the daily chart.
Greed provides the backdrop, but it cannot be confirmed whether RAY will break through.
The Fear and Greed Index is at 64, reflecting the risk appetite of the crypto market, but it does not confirm any specific breakout for Raydium. Alternative.me classifies this reading as "greedy." CoinGecko shows that the total market value of cryptocurrencies is 2.83 trillion US dollars, with Bitcoin holding a dominant share of 58.77%. These sentiment readings provide context for risk appetite, but these overall market levels do not prove the asset-level demand for Raydium nor do they confirm any breakout scenarios for it.
Frequently Asked Questions

Is the main sentiment for RAY bullish or bearish?
On the daily chart, the trend is generally bullish. All three trailing daily moving averages are below the price level and indicate a bullish trend. However, the overbought daily line RSI increases the risk of pullbacks.
Can 15-minute momentum resolve the discrepancies on the hourly chart?
No. The 15-minute bar chart, which shows a positive trend and is on an enlarged scale, provides a favorable context for execution, but the hourly bar chart still shows a negative trend. Readings from shorter time periods cannot replace the trigger conditions based on the hourly closing price.
Do these data describe completed candlestick charts?
The transaction prices cited in the text are real-time prices. The moving averages, momentum indicators, and pivot points are all calculated based on completed candlesticks; therefore, the current price is not equal to the confirmed closing price of the candlestick.
This article was generated with the assistance of artificial intelligence and has been reviewed by an editorial team.
Algorand managed to stay above the daily R1 level of $0.1237, but the closing price still needs to be confirmed.
Atom Testing the $1.79 resistance level, but the daily breakout has not yet been confirmed.
Curve DAO needs to close above $0.3957 on the hourly chart to continue its upward trend
Stay informed about all the latest news regarding cryptocurrencies and the entire blockchain world in a timely manner.
Selected Videos
OKX and a joint venture under the parent company of the New York Stock Exchange plan to trade tokenized securities of over 60 stocks
Ray Dalio claims that the artificial intelligence investment bubble is approaching a critical point
As Bitcoin fell below $84,000, the liquidation amount in the crypto market soared by 235% to $547 million.
Stacks breaks through the daily line; R1, 15-minute RSI reaches overbought territory