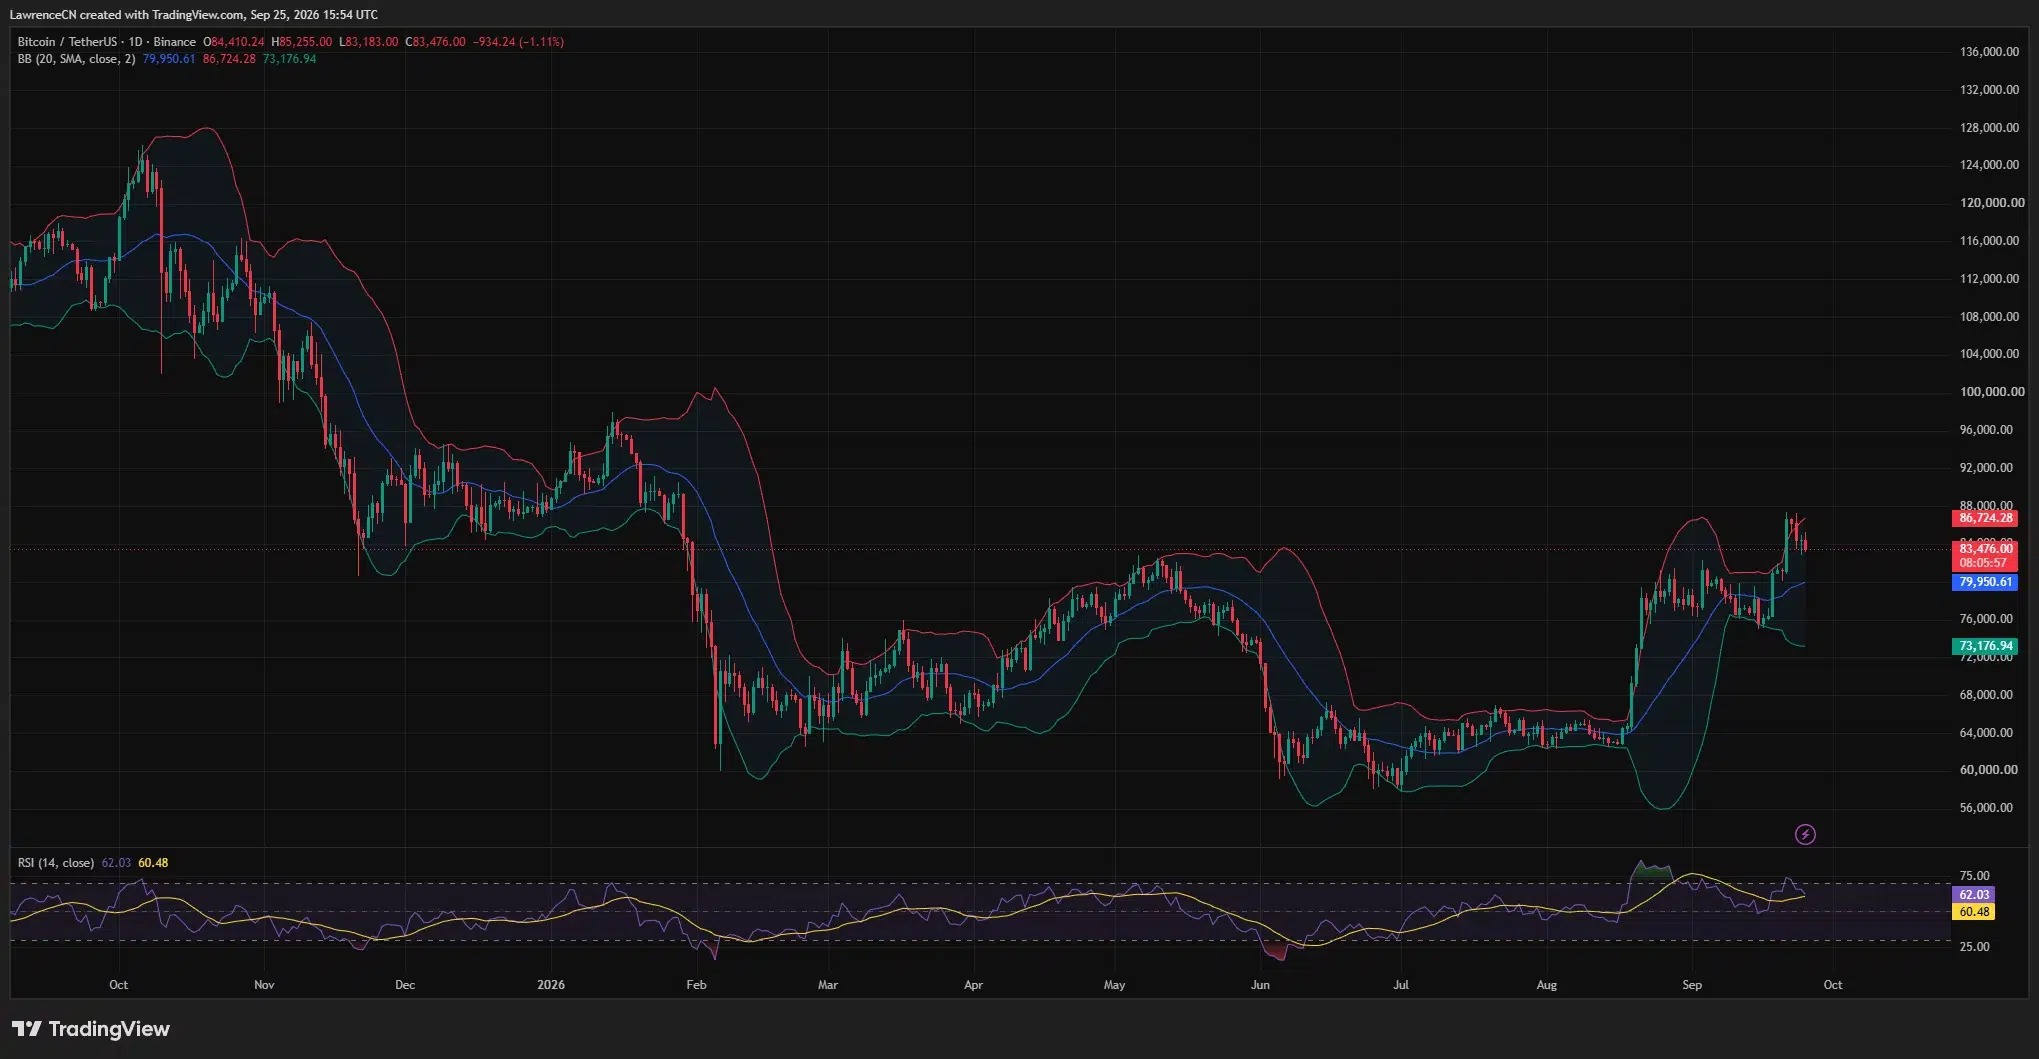


US spot Bitcoin funds attracted billions of dollars in capital inflows in late September, but the on-chain estimates for demand for cryptocurrencies in the broader market remain negative. The two sets of data measure different things, and the discrepancy between them has become a key issue in determining whether this latest upward trend has enough buyers beyond the scope of fund channels.
- According to the daily data from Farside, US spot Bitcoin ETF attracted approximately $2.39 billion in capital inflows from September 21 to September 25.
- The 30-day "apparent spot demand" for CryptoQuant improved from around -182,000 on September 24 to -101,000 on October 1, BTC, but it has not yet turned positive.
- Fund shares can be traded among investors without the need to create new shares, nor is there a requirement to purchase additional bitcoins with the base amount.
- The latest daily fund totals are less certain: Farside recorded a net inflow of $189.9 million on October 2nd, and a net outflow of $89.8 million on October 5th; there is still a missing entry for October 6th to this day.
- The next test point is whether fund subscriptions will continue, as well as whether there will be broader changes in coin accumulation, exchange demand, and price trends.
The surge in September is clearly visible in the fund charts of Farside Investors. Over five consecutive trading days, amounts of approximately $999 million, $714.7 million, $346.9 million, $190.7 million, and $134.5 million were recorded respectively. This refers to the net dollars flowing into US spot products, not to the actual number of bitcoins purchased by each participant in the market. It indicates that after a summer period of significant instability, there is once again a clear demand for investment packaging tools.
The "apparent demand" series for CryptoQuant provides a different perspective. Although there was a clear improvement starting from late September, its 30-day reading was still below zero at the beginning of October. There is no arithmetic contradiction here: one series tracks the net subscription amount of a group of funds during a trading day, measured in US dollars; the other estimates the changes in the demand for coins in the spot market over a rolling one-month period. Neither can identify each individual ultimate buyer.
What actually happens in Bitcoin funds?
When investors buy an existing ETF share on a stock exchange, they usually trade with another holder or market maker. For this type of secondary market transaction, the fund may not issue new shares, nor may it necessarily purchase an additional coin as a result. Net subscriptions and redemptions can change the number of fund shares and their underlying exposures; daily fund flow estimates are precisely designed to capture these changes. Nevertheless, time differences, inventory levels of authorized participants, and disclosures by issuers can lead to discrepancies between the dollar flows indicated in quotes and the actual spot purchases on the same day.
As long as there are those who regard record trading volumes as evidence of “fresh demand for Bitcoin,” this distinction is quite important. A high turnover rate may indicate strong interest, or it could simply be a rapid transfer of risk among holders. It in itself does not prove an increase in the total holdings of funds. More useful corroborative evidence includes the direction of net subscriptions, changes in holdings, the transaction prices of the coin, and whether there are still independent buyers continuously accumulating positions.
This concentration was evident on the first trading day of September. Farside recorded a total net inflow of $999 million as of September 21; the table shows that IBIT from BlackRock contributed $381.4 million, FBTC from Fidelity contributed $238.8 million, and ARKB from ARK and 21Shares contributed $289.1 million. The other products contributed smaller amounts, or even none at all. A single large institution operating through one fund could potentially change the total amount, which does not mean that each trading venue has the same intensity of buying orders.
There are also boundaries to the total amount over these five days. On September 30th, there was a net outflow of $148.7 million; on October 1st, there was a net inflow of $102.7 million; on October 2nd, there was a net inflow of $189.9 million; and on October 5th, there was a net outflow of $89.8 million. Farside As of the time this table for October 6th was being compiled, some funds still had missing values. Therefore, the total amount displayed should not be considered as the final system-wide result. The conclusion that can be drawn from the completed rows is that there was a strong surge in capital inflows in late September, followed by more volatile daily subscriptions thereafter.
Why can there be a coexistence of fund purchases and negative spot demand?
Bitcoin is not only issued through ETF. Miners receive newly minted coins, while existing holders decide whether to spend them or continue holding them. Traders transfer their holdings to exchanges, and buyers also purchase coins through custodian institutions, over-the-counter trading desks, and exchanges other than American funds. Funds can increase their exposure, and the amount of coins sold by other holders exceeds what new buyers absorb.
The apparent demand for CryptoQuant is an estimate based on on-chain supply behavior, rather than a census of named consumers or a direct measurement of the buy orders in the order book. A negative reading over 30 days indicates that, according to the platform's method, demand has not yet caught up with the relevant supply indicators during this period. This does not mean that no one bought Bitcoin throughout the month. The reading improved from around -182,000 BTC on September 24th to -101,000 BTC on October 1st, indicating that the imbalance has been reduced by about 81,000 BTC under this model, but it is still considered an imbalance.
There are also issues with the units in this comparison. The ETF volume of 2.39 billion US dollars is recorded over 5 trading days in the US markets; whereas the apparent demand reading of -101,000 BTC represents the number of coins over 30 natural days. Even if the former is converted at a certain spot price, it is not possible to directly add the two figures together. During that period, prices were changing, investors' order settlement paths were different, and the time windows did not completely overlap. It is precisely for this reason that these two sets of data are valuable: they reveal different aspects of the market.
The September research report for CryptoQuant also indicated in the late September assessment that the apparent demand for 30-day BTC had contracted by about 170,000 units. The figures can vary depending on the date and the calculation method used. These figures are more suitable for determining the direction and sustainability of trends, rather than identifying who the marginal buyers are. Reports evaluating the September bull market for crypto.news also described the same gap between ETF orders and broader demand estimates.
Buyers outside of the packaging are even harder to see.
Exchange balances are often used as a proxy indicator of available supply, but a single withdrawal may signify self-hosting, transferring to another custodian institution, mobilizing collateral, or internal wallet maintenance. A single deposit may precede a sale, or it may simply mean changing locations. On-chain records can identify addresses and transactions, but they cannot automatically discern the intentions of individuals. If analysts claim that a certain type of investor has filled a gap, then more evidence is needed than just balance charts.
Coinbase premium – that is, the comparison between the prices of US exchanges and overseas markets – provides a narrower window for observing regional spot buying interest. CryptoQuant Comments at the beginning of October mentioned that while demand estimates had improved, premium remained negative. This is consistent with the relatively weak buying interest on US exchanges at that time, although arbitrage, differences in venue liquidity, and the specific sampling window can all affect this signal. ETF Subscriptions may be completed through trading desks, while the spot prices on US exchanges remain soft.
Futures provide another path for price exposure that does not require investors to directly buy and hold the underlying currency. Leveraged long positions can push up prices during a short squeeze, and then disappear quickly when the collateral is sold or the position is closed out. According to an analyst cited by Bitfinex, as Bitcoin's upward trend approached $90,000, the weekly inflow of funds also slowed down. This is merely an interpretation of market views and does not prove that fund flows alone caused the slowdown. Fund rates, open interest, and clearing data can help distinguish between leveraged demand and the buying interest that remains even after the price increase.
Centralized fund channels indeed possess real purchasing power.
This mismatch should not overshadow the scale of the ETF market. The cumulative figures from Farside show that since the launch of the US spot products, the total net subscriptions have reached tens of billions of dollars. The fund provides brokerage accounts with access channels, familiar custody methods, and tools that many institutions can hold under existing authorization. Continuous net subscriptions can draw coins out of the circulating trading inventory, even though the direct order paths are not visible on retail exchange charts. Reports of fund differentiation at the beginning of October from crypto.news also highlight the differences between Bitcoin and Ethereum products in the intraday landscape.
However, the cumulative traffic does not equal the current marginal demand. It adds up all previous subscriptions and redemptions in nominal dollars. Changes in the price of Bitcoin will affect the dollar value of the fund's holdings, but they do not generate new traffic; the same institution may also switch between different products. The week in late September was just a period of observed net subscriptions, which does not mean that the fund will continue to buy at the same pace in October.
There are also differences between institutions entering the market channels and transactions based on identifiable institutional beliefs. Funds may be used for pure long positions, hedging basis positions, or temporary portfolio exposures. Public daily traffic tables cannot break down these strategies. The report on the return of buying orders regarding ETF on October 2nd describes the current price disputes; a more difficult question to answer is whether these buying orders will remain when trading opportunities change.
What can bridge this gap?
Stronger confirmation should combine several independent observations from the same period: continuous net subscriptions to funds, a positive and sustained apparent spot demand, reduced selling pressure from existing holders, and spot transaction prices that are consistent with continuous buying orders. None of these factors is absolutely reliable on its own, but taken together, they are more indicative of a widespread accumulation process than a single weekly ETF figure.
The reverse combination is also enlightening. If the capital flow turns negative again, while the apparent demand remains below zero, then price increases may become increasingly dependent on leverage or on a supply environment with thin immediate selling orders. This does not mean that a specific price or date can be predicted; it simply indicates that among the visible indicators, the sources of buying orders have not yet expanded sufficiently. Previous reports from crypto.news regarding the next bull market also pointed out that the inflow of ETF, spot demand, and participation beyond a few major cryptocurrencies need to continue together.
Traffic priced in US dollars can also make the market appear to have a stronger coin accumulation than it actually does, especially when prices are higher. With a fixed amount of subscription, when each coin is more expensive, only fewer BTC can be purchased. Conversely, when prices are lower, a smaller inflow of US dollars may correspond to a larger number of coins. Fund analysts can compare subscription amounts with disclosed changes in holdings based on the number of coins, but they must be cautious about delays in disclosure and the physical delivery mechanism. This approach is more appropriate than treating US dollars and BTC as the same unit of measurement.
Calendars may magnify turning points.
The capital inflows over five consecutive trading days in September were indeed a surge, but if one selects data for a week centered around a high point, it may make the underlying trend appear smoother than it actually is. The subsequent sequence includes: milder inflows on September 28th and 29th, a net outflow on September 30th, positive inflows for the following two days, and then another net outflow on October 5th. The weekly net flow can remain positive, while individual funds may change direction; the monthly total may also obscure the several days when sellers were dominant. The time span should match the argument being made. Data for a single day answers the question of whether marginal fund buyers were present on that day; data for a month is more suitable for observing whether the allocation is still being maintained.
The table for Farside represents a consolidated estimate at the fund level, and missing values are not equivalent to zero. A value of zero indicates that the provider did not record any net flow for that product; dashes in incomplete rows signify that the information was not available at that time point. The main entry for October 6th is displayed as a dash. If the total amount is reported directly without this clarification, it could lead to incorrect market signals due to incomplete data. The next revision may result in significant changes to the headline figures.
There are also subtle geographical differences in this comparison. The ETF data in the United States records traffic for products listed in the US, but the ultimate investors may be global institutions participating through US brokerage channels. The apparent demand on-chain shown by CryptoQuant covers coins that flow within a global network. The US exchanges sampled by premium represent another geographic and liquidity segment. Fund allocations can be real, while premium may still indicate a lack of immediate buy orders on a particular exchange. These observations address questions that overlap to some extent, but are not identical.
There is no need to force these indicators into a single conclusion. If funds continue to accumulate while the broader spot demand remains negative, then it is possible that the funds are absorbing some of the miners or existing holders' distributions. This can support prices better than having no demand for funds at all, but it does not prove that there is a shortage of available coins in the entire market. If demand readings turn positive later on, it may indicate that the balance has changed; if fund flows turn negative again, it suggests that even the contribution from packaging tools is not as reliable as it seemed during that week in September. What is truly important is the time series, rather than the dramatic figures of a single day.
What to watch next
The completed daily lines, as well as the updates to the issuer's holdings, will determine whether the subscription in October will continue after the surge in late September. Lines with blank entries for major funds should still be considered provisional. The next 30-day apparent demand reading will show whether the contraction will continue to approach zero or reverse again. U.S. exchanges, old coin expenditures, and exchange order books can all provide context, but each of these may be distorted by trading venues and custody conversions.
The current issue is not whether ETF bought Bitcoin on a particular trading day. Recorded fund subscriptions indicate that demand does indeed return at certain points in time. The unresolved question is whether there are enough other buyers in the entire spot market to absorb the selling pressure. Evidence from October 7th shows that broader demand estimates have improved, but they have not yet turned positive.
Frequently Asked Questions
Did Bitcoin ETF buy $2.39 billion worth of Bitcoin within a week?
Farside From September 21st to 25th, there was a net inflow of approximately $2.39 billion into the fund. This refers to the dollars that flowed into the fund shares; the timing and process of purchasing the underlying tokens are much more complex than the "one-to-one purchases" seen in retail transactions.
Does a negative apparent demand mean that no one is buying Bitcoin?
No. It means that the provider's rolling estimate of demand for a broader range of cryptocurrencies is still lower than their comparative supply indicators. During this period, both buyers and sellers were very active.
Why isn't trading on the secondary market ETF considered new inflow?
Existing shares can have their holders changed without the fund issuing new shares. What truly affects the total exposure of the fund are net subscriptions and net redemptions, not just share transfers.
Are negative Coinbase and premium decisive?
No. It may suggest that the buying interest from US exchanges is relatively weaker compared to overseas markets, but arbitrage, liquidity, and observation windows all complicate such inferences.
Can futures drive up the price of Bitcoin without any accumulation of spot goods?
Yes. Leverage exposure and short covering can drive up prices, but such price increases may not be as sustained as those seen from the widespread buying of unleveraged coins.
What is the latest completed ETF traffic?
Farside On October 5th, there was a net outflow of 89.8 million US dollars as shown in the row. On October 6th, when checking, a major fund entry was still missing, so the total amount displayed is only provisional.
What constitutes stronger evidence of widespread demand?
Sustained net fund subscriptions, positive readings of apparent spot demand, as well as coin holdings and spot market behavior corroborating within similar time frames, are more persuasive than a single data point alone.
Can these indicators predict price targets?
No. What they describe is the balance between recent fund subscriptions and the estimated demand for coins, which neither determines future prices nor guarantees that the latest trends will continue.