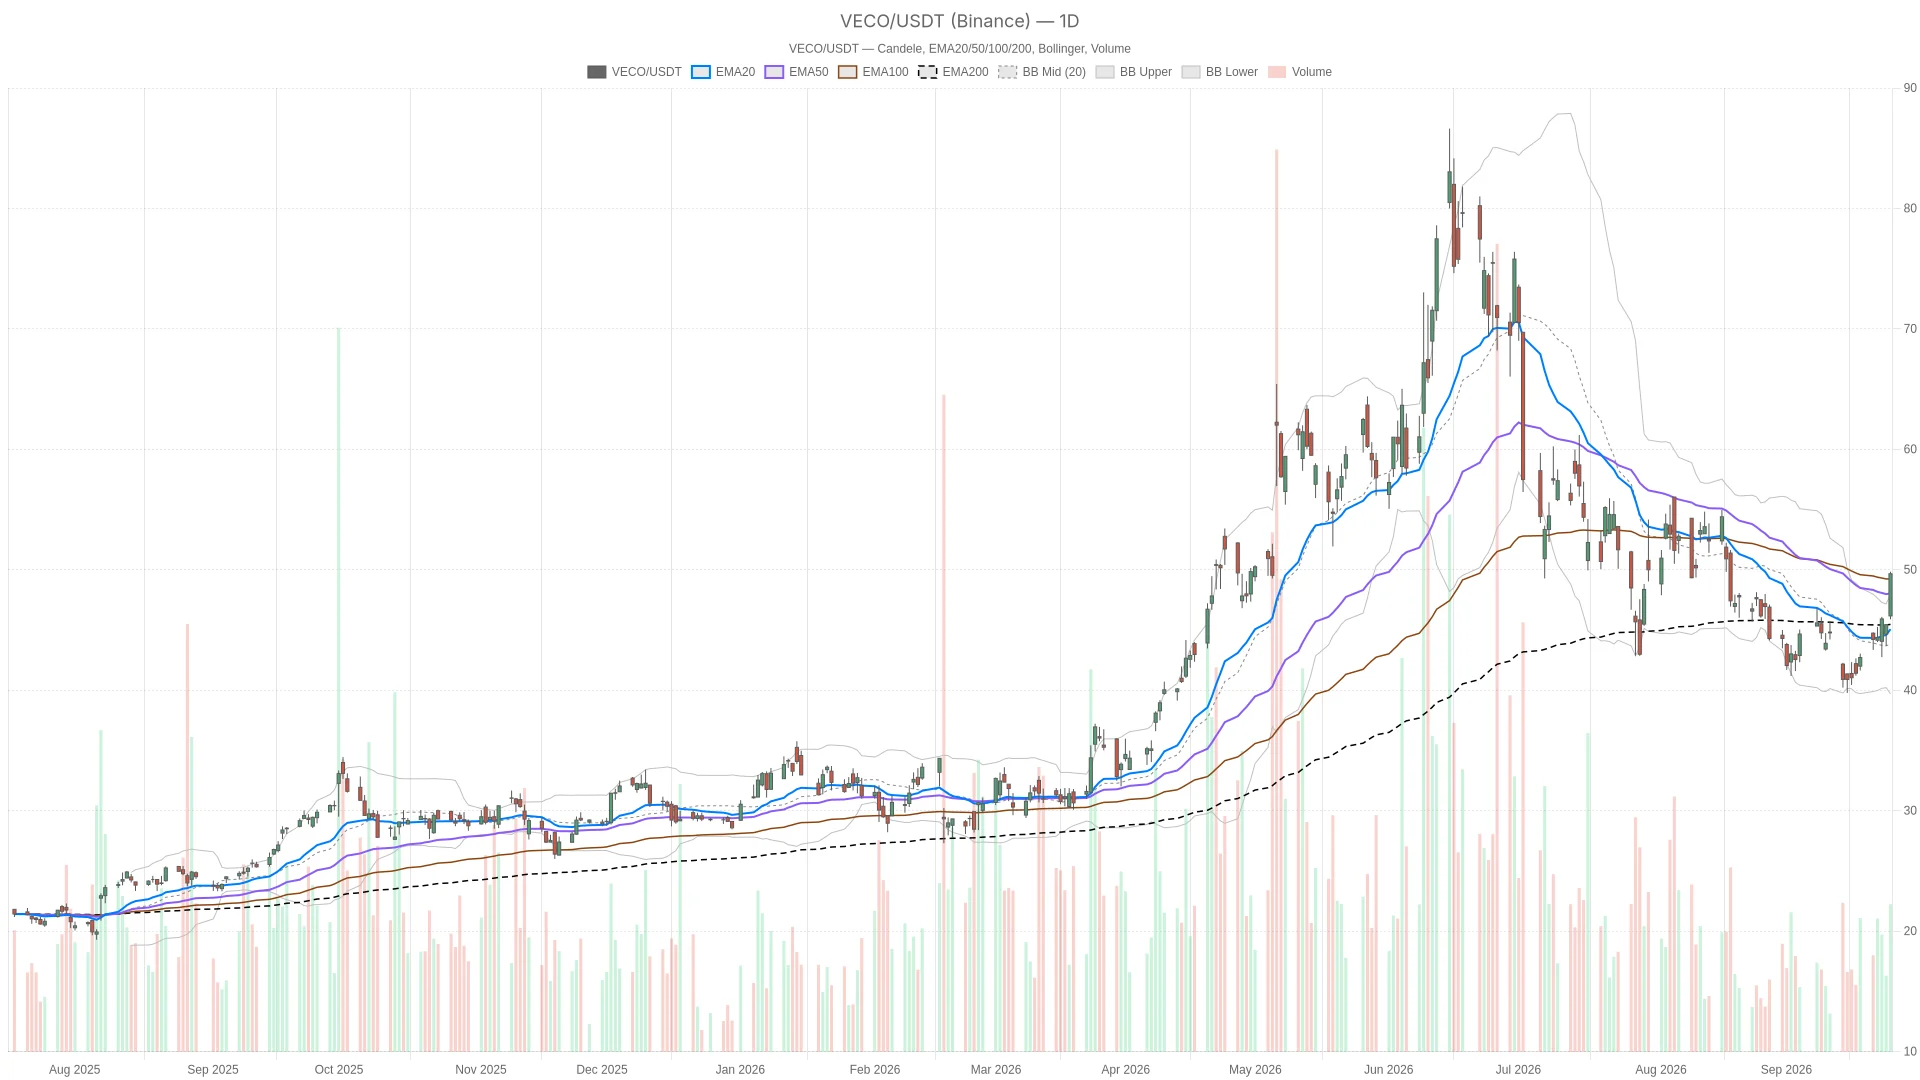
On September 25th, the stock price soared by approximately 9% to close at $49.67, continuing the upward trend from seven of the past eight trading days. This rapid rebound, driven by news, is testing key resistance levels across various time frames and has created a tug-of-war between strong momentum and overbought signals.
Key Points
- On September 25, the stock price rose by approximately 9%, from the previous trading day's closing price of $45.45 to $49.67.
- In the past 8 trading days, this stock has risen on 7 of them. The driving factors include comments related to "performance exceeding expectations" as well as narratives about a booming storage capacity market.
- The daily line RSI14 is at 60.58, indicating relatively strong momentum, but it has not yet reached the classic overbought range.
- Despite the breakthrough, the regime classification on the daily chart remains neutral, indicating that the trend indicators have not yet confirmed this upward movement.
- The hourly chart RSI14 reached 75.94, indicating that this rebound has become quite strong on a intraday basis.
Daily chart structure: A breakout has occurred, but technical indicators have not yet been fully confirmed.
The daily chart shows a strong breakout, but the underlying trend indicators have not yet verified this movement. Price action is clearly bullish, yet regime is still marked as neutral – this is precisely the core tension in the current Veeco Instruments stock price structure.
Moving averages are arranged to send mixed signals.

The stock price closed at $49.67, with the intraday range being between $45.89 and $49.84. It has firmly surpassed the levels of $45.07 (marked as EMA20) and $45.47 (marked as EMA200), and also broken through $48.05 (marked as EMA50).
On the surface, this appears to be a textbook example of a bullish arrangement. However, the sequence of EMA presents a more nuanced picture. EMA20 is still below EMA200, which means that the short-term moving averages have not yet caught up with the extent of this upward trend. In fact, this is quite common after a sharp, gap-up rebound. The trend has not had enough time to mature within the moving average system.
Kinetic energy and volatility are in a transitional state.
The daily line RSI14 is at 60.58, indicating relatively strong momentum, but it has not yet entered the classic overbought range. It is worth noting that with such a large amplitude of the daily bullish candlestick, this reading is already quite good.
At the same time, MACD presents a more complex picture. The MACD line is still negative, at -0.68, which is lower than the signal line of -1.64. However, the bar chart has turned positive, showing 0.97. The downward momentum of the previous weeks is weakening, and bullish momentum is beginning to build. But the MACD line has not yet truly crossed above the positive range. This is a market in transition, not a fully confirmed trend.
The Bollinger Bands provide additional context. The middle band is at $43.83, and the upper band is at $47.96; however, the closing price on Thursday was completely above the upper band. This is a typical volatility breakout signal, indicating that prices are extending beyond the normal statistical range. Usually, this reflects strong buying confidence, but it also increases the likelihood of a pause in the mean-reversion decline.
ATR14 is at 2.28, confirming that the intraday volatility has significantly increased with this upward movement. The daily pivot point is at $48.47, R1 is at $51.04, and S1 is at $47.09. The price is currently above the pivot point and is approaching R1. However, the daily regime classification still shows neutral. The price trend is already faster than the trend confirmation. The market sentiment is clearly bullish, but the underlying indicators are still catching up.
Hourly level: Kinetic energy truly exists, but it has become overheated.
The 1-hour chart confirms a bullish trend, and it also indicates that the rebound in the price of Veeco Instruments has been quite intense. There is no doubt about the overall bullish trend, but overbought conditions in RSI and approaching resistance levels mean caution is needed.
Overbought RSI and Bollinger Band Pressure
However, RSI14 has reached 75.94, firmly within the overbought range. This does not deny the upward trend, but it indicates that this wave of increase has been somewhat excessive on a intraday basis. At the hourly level, MACD is clearly bullish: the MACD line is at 1.4, higher than the signal line of 1.0, and the bar chart shows a positive value of 0.4. The momentum here has been confirmed, not just recently emerged.
The Bollinger Bands structure is also quite explanatory. The upper band is at $49.87, while the price is at $49.67, indicating that the stock price is near the ceiling of the short-term volatility range. The ATR for the hourly time frame is 0.98, showing that volatility has cooled down compared to the gap-up phase on the daily chart. This is consistent with the market having completed a significant move and now entering a digestion phase.
The hourly pivot point is at $49.59, while R1 is at $49.92, forming the current key battleground area. Prices are hovering below R1. If they can cleanly break through this level, it will be the next signal for a continuation of the upward trend. Overall, the 1-hour period confirms a bullish bias on the daily chart, but it also indicates that this rebound may pause in the vicinity of resistance levels in the short term.
15-minute execution perspective
The 15-minute chart indicates that the market is taking a breather, rather than reversing. EMA20 is at $48.58, EMA50 is at $47.18, EMA200 is at $44.81, all still maintaining a bullish stance, and the regime tag also remains bullish.
However, RSI14 is still as high as 74.52, indicating an overbought condition. The bar chart for MACD has turned slightly negative, at -0.02. This is a subtle but real signal: just as the price is testing the resistance level, the short-term momentum is weakening. The line for MACD is at 0.84, slightly higher than the signal line of 0.86.
The price is trading almost at the 15-minute pivot point of $49.69; R1 is at $49.82, and S1 is at $49.54. This narrow range indicates that the market is hesitant at the current price level. The upper Bollinger Band of $49.90 almost completely overlaps with this pivot resistance zone. The market is at a true decision-making point.
From the perspective of timing of execution, if there is a significant increase in volume to break through the range of $49.82 to $49.90, it will be conducive to continuing the upward trend; however, if it falls below $49.54 and retracts to around $48.58 (which is the EMA20 level), it would more likely indicate the beginning of a cooling period rather than a reversal in trend.
Veeco Instruments Bullish Scenario for Stock Prices
The premise for a bullish scenario is that the daily breakout can be maintained, and that trend indicators gradually catch up. If the price completes consolidation above the upper band of the daily Bollinger Bands at $47.96, as well as above $48.05 (which is marked as EMA50), and continues to rise above $51.04 (marked as R1), then this upward movement will be verified as the starting point of a new round of growth.
If the daily line MACD crosses above the signal line, it will also support the judgment that regime has truly turned bullish. If EMA20 crosses above EMA200 again, it will provide additional confirmation. On the hourly chart, if the price closes clearly above $49.92 and there is no downward divergence in RSI, it will also strengthen the logic for a continuation of the upward trend.
Bearish scenario
The core of the bearish scenario lies in the current resistance level being rejected. If it is not possible to break through the 49.92 USD level at the hourly time frame, as well as the pivot resistance zone between 49.70 USD and 49.90 USD on the 15-minute chart, it indicates that the short-term momentum of this rebound is beginning to fade. The 15-minute MACD bar chart has also turned negative, which supports this risk.
In this case, a pullback to the daily pivot point of $48.47 or $48.05 (which is also EMA50) would be more in line with a normal retracement rather than a trend reversal. If the daily close falls below $48.05 (which is EMA50), then the bullish scenario would no longer hold. If it falls below $47.09 (which is S1), it would indicate that the breakout of the Bollinger Bands was a false breakout and not a real acceleration of the trend.
Closing Viewpoint
Veeco Instruments The stock price is at a rather critical level. The strong momentum seen on the daily chart, which led to a breakout, has been confirmed by the bullish pattern on the hourly chart. However, both the overbought readings on the hourly and 15-minute timeframes suggest that caution is needed when chasing higher prices at the current level. RSI
Despite the significant increase in stock prices, the daily chart regime is still marked as neutral, with trend confirmation lagging behind. Since the price is near key pivot resistance levels across multiple time frames, the next few trading days will help determine whether this trend is sustainable. Given the recent large gaps and the coexistence of overbought conditions at various levels, the uncertainty regarding the short-term direction remains high. When managing positions around these price levels, this factor should be taken into consideration.
Frequently Asked Questions
Veeco Instruments Is the stock price currently overbought?
It depends on the time frame. On the daily chart, RSI14, it is at 60.58, which is considered strong but not overbought; however, on the hourly chart, RSI14, it is at 75.94, and on the 15-minute chart, RSI14, it is at 74.52, both of which are in the overbought range, indicating that the intraday rebound has become quite intense.
Where is the key resistance level for VECO?
The most direct resistance level is $49.92 at the hourly R1 level, and the upper band of the 15-minute Bollinger Bands at $49.90 also provides support. Further above, $51.04 at the daily R1 level is the next important upward target.
What will confirm that this breakthrough is real?
If the daily close price exceeds $51.04 at R1, and at the same time the daily MACD line crosses above the signal line, and EMA20 re-crosses above EMA200, then a breakout can be confirmed. On the hourly chart, if the price clearly closes above $49.92 without any divergence from RSI, that would also support a bullish outlook.
What could negate a bullish scenario?
If the daily close falls below $48.05, which is marked as EMA50, or below $47.09, which is marked as S1, it may indicate that the breakout above the Bollinger Bands was a false move, and the market will turn towards a deeper pullback.
DisclaimerThis article is for informational purposes only and does not constitute financial advice, investment advice, or an offer or solicitation to buy or sell any financial instruments or cryptocurrencies. The analysis provided does not represent future results. Investing in crypto assets and financial markets carries a high risk of capital loss. Before making any decisions, please conduct your own research ( DYOR ) and consult a qualified financial advisor.
This article was generated with the assistance of artificial intelligence and has been reviewed by an editorial team.