












XRP currently trades within two Elliott Wave structures, and its ultimate price target would depend on which structure it actually follows.
This comes as the XRP price recovers above the $1.45 amid a broader market-wide upward push. Notably, after dropping to $1.34 on April 29, XRP engineered a rebound push which has since taken the price to $1.455 at press time, hinting at possible further upside to new highs.
Key Points
- XRP has recovered more than 8% from the April 29 lows of $1.34, now on an upward path.
- In this upward path, XRP trades within two distinct Elliott Wave structures on the weekly chart.
- XRP’s ultimate target in the upward path depends heavily on which of the Elliott Wave structures it eventually follows.
- The first structure began in June 2022, and Wave 5 could end during this cycle at $14.
- The second structure started in late 2024, and Wave 5 could conclude years later at $42.
XRP Within Two Elliott Wave Structures Amid Recovery
CryptoInsightUK, a well-known market technician, discussed XRP’s current position in a recent analysis on the back of the latest recovery push. Specifically, the XRP price has rebounded alongside the broader crypto market, which has added $200 billion in market cap since the April lows.
Riding on this wave, XRP has reclaimed the $1.45 mark, up 8.2% from the April 29 low of $1.34. Due to this uptrend, XRP recorded a 6.13% gain last week, marking its largest weekly rise in two months. Despite a mild 1.08% pullback this new week, XRP has maintained the $1.45 mark, currently trading for $1.4573.
Interestingly, CryptoInsightUK’s chart shows that, amid the uptrend, XRP currently trades within two different Elliott Wave structures. According to him, there is the possibility that either of the two structures would guide XRP’s price action. However, uncertainty remains.
XRP Targets for Each Structure
For context, the first Elliott Wave structure began after XRP started recovering from the 2022 bear market lows in June of that year.
Specifically, Wave 1 ended when XRP hit a high of $0.93 in July 2023, while Wave 2 concluded at a low of $0.3834 in July 2024. Meanwhile, Wave 3 pushed prices to $2.9 by December 2024, and Wave 4 resulted in a pullback to the current position.
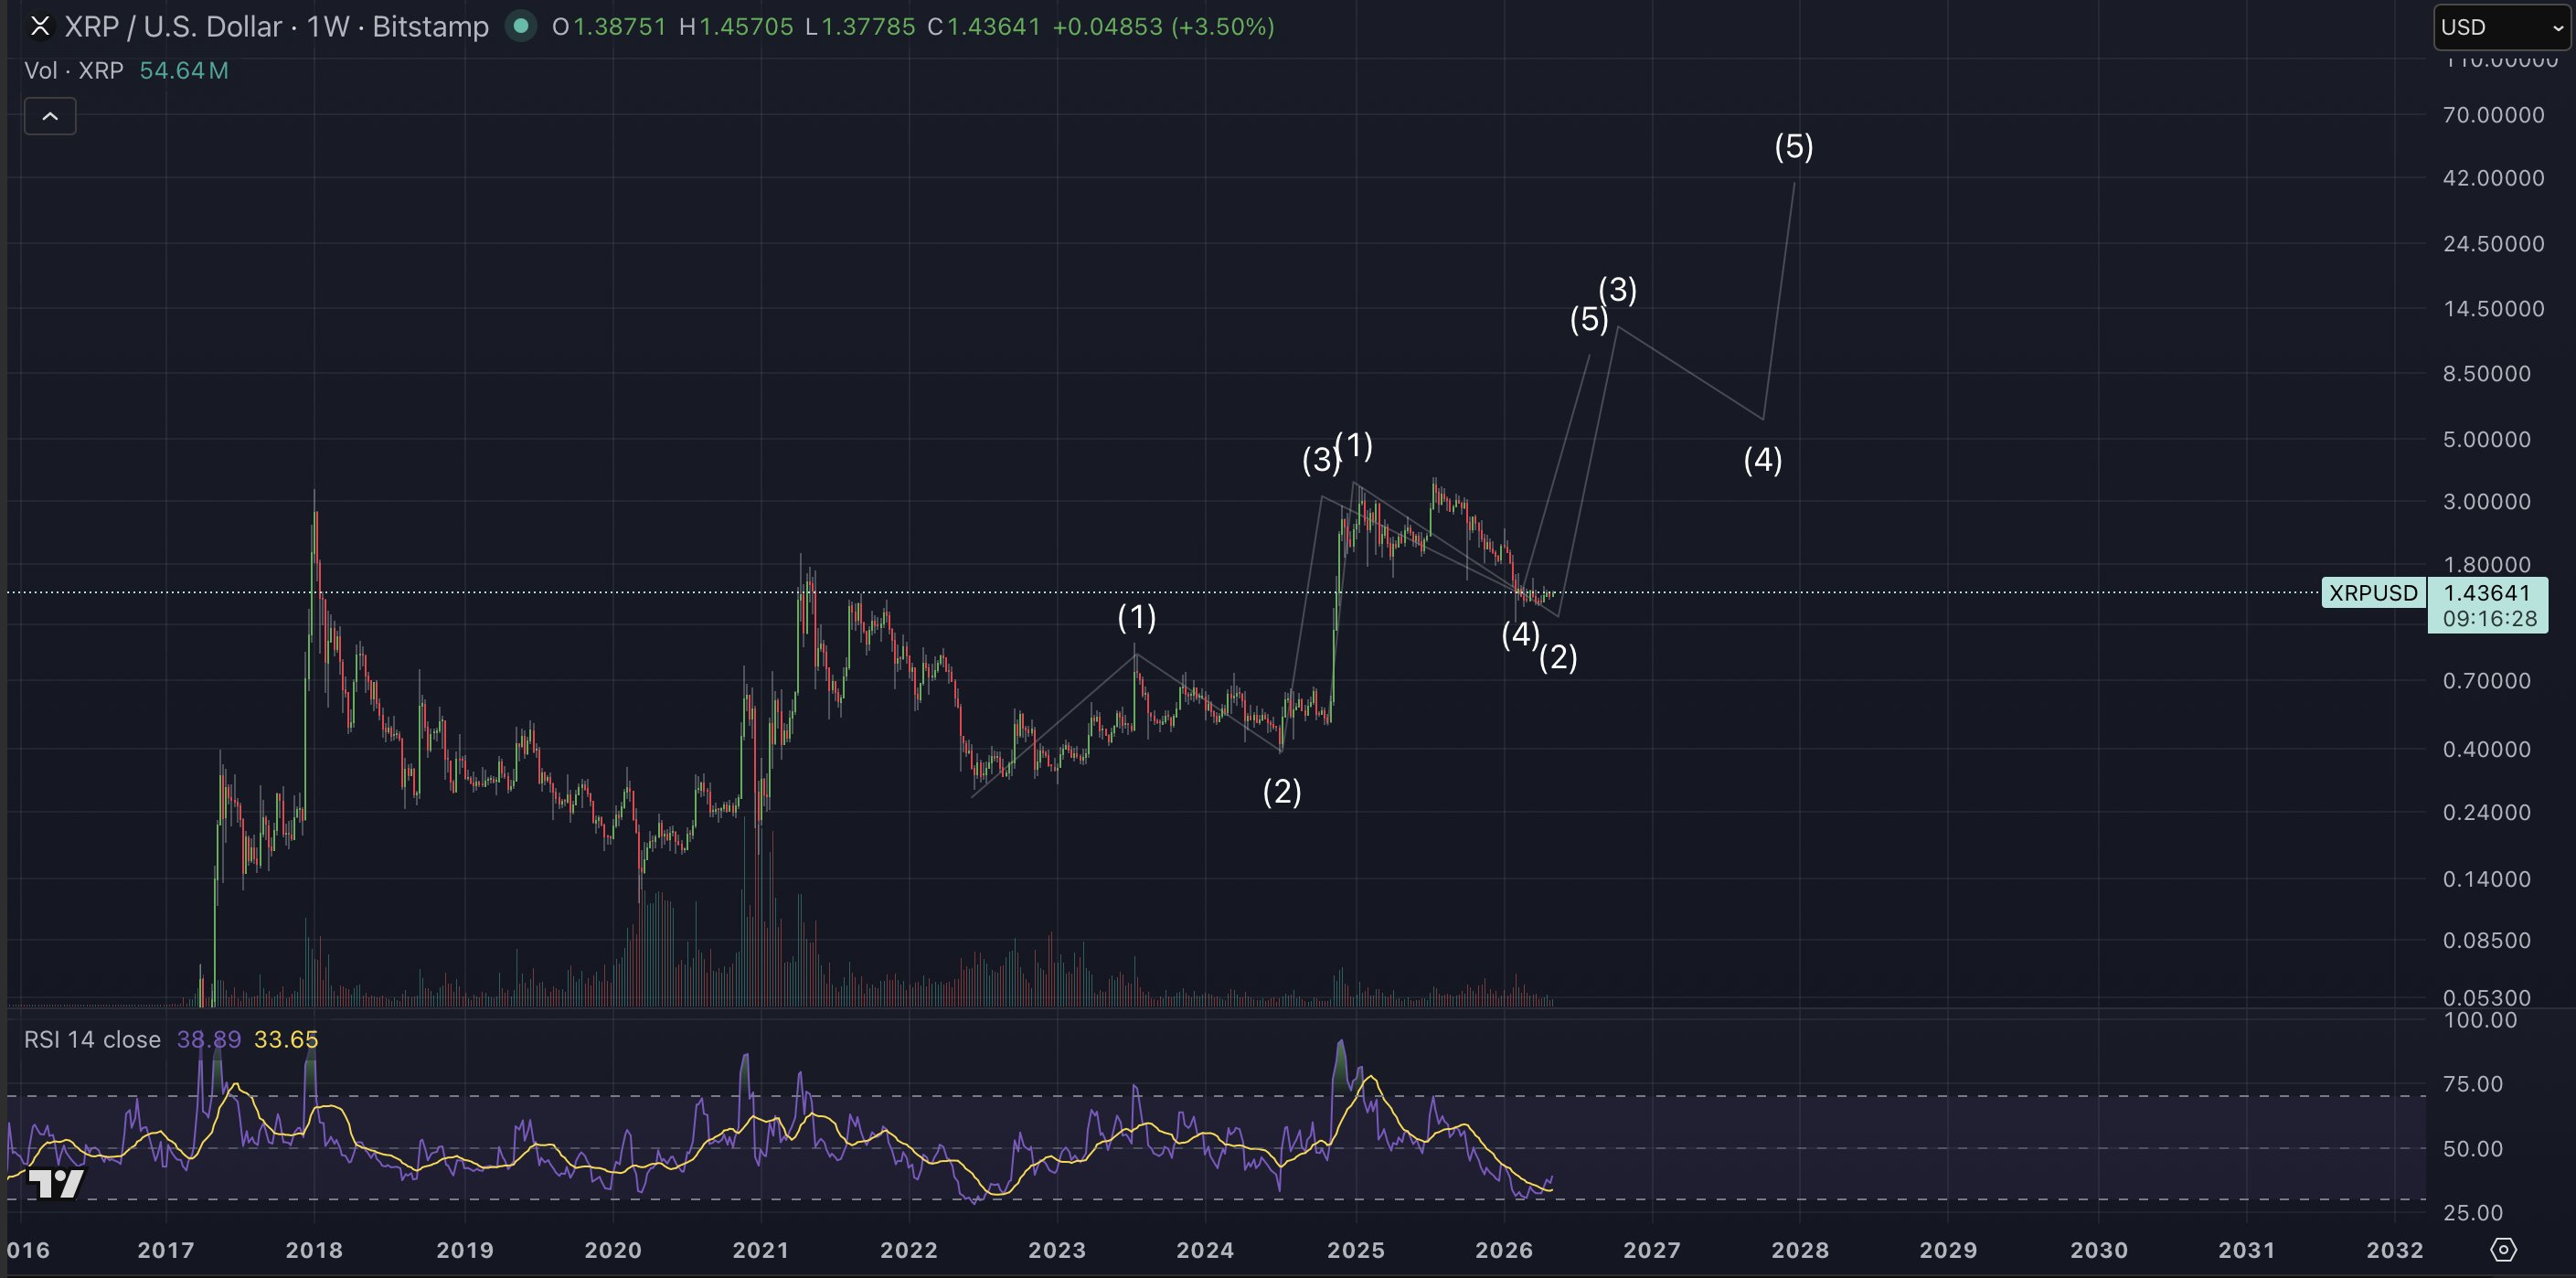
If XRP follows this structure, it is on the verge of entering an impulsive Wave 5 upsurge once the current Wave 4 concludes. Data from the chart shows that this Wave 5 could take XRP to a range of $12 to $14.5, marking the end of the structure.
However, the second structure began when XRP rallied from $0.5 in November 2024 to $3.4 by January 2025. This upsurge marked Wave 1. Meanwhile, Wave 2 began as XRP corrected from the $3.4 peak and has continued till now.
If XRP is following the second structure, then the anticipated recovery from the current correction would mark its Wave 3 push, potentially leading to $14. However, after this, XRP could pull back during Wave 4 to just above $5 before rebounding toward $42 in Wave 5.
Essentially, for the short term, XRP could target $12 to $14 either in Wave 3 or Wave 5, depending on the structure it follows. As a result, CryptoInsightUK confirmed he would likely reduce his exposure once XRP hits the $8 to $12 range.