

Foreign media analysis suggests that the crypto market continued its consolidation at the end of July, with Bitcoin, Solana, and Zcash all hovering near key price levels. The article argues that all three assets currently lack sufficient upward momentum, and the short-term movement appears more like a test of support levels than the start of a clear rebound.
SOL fell back below the moving average.
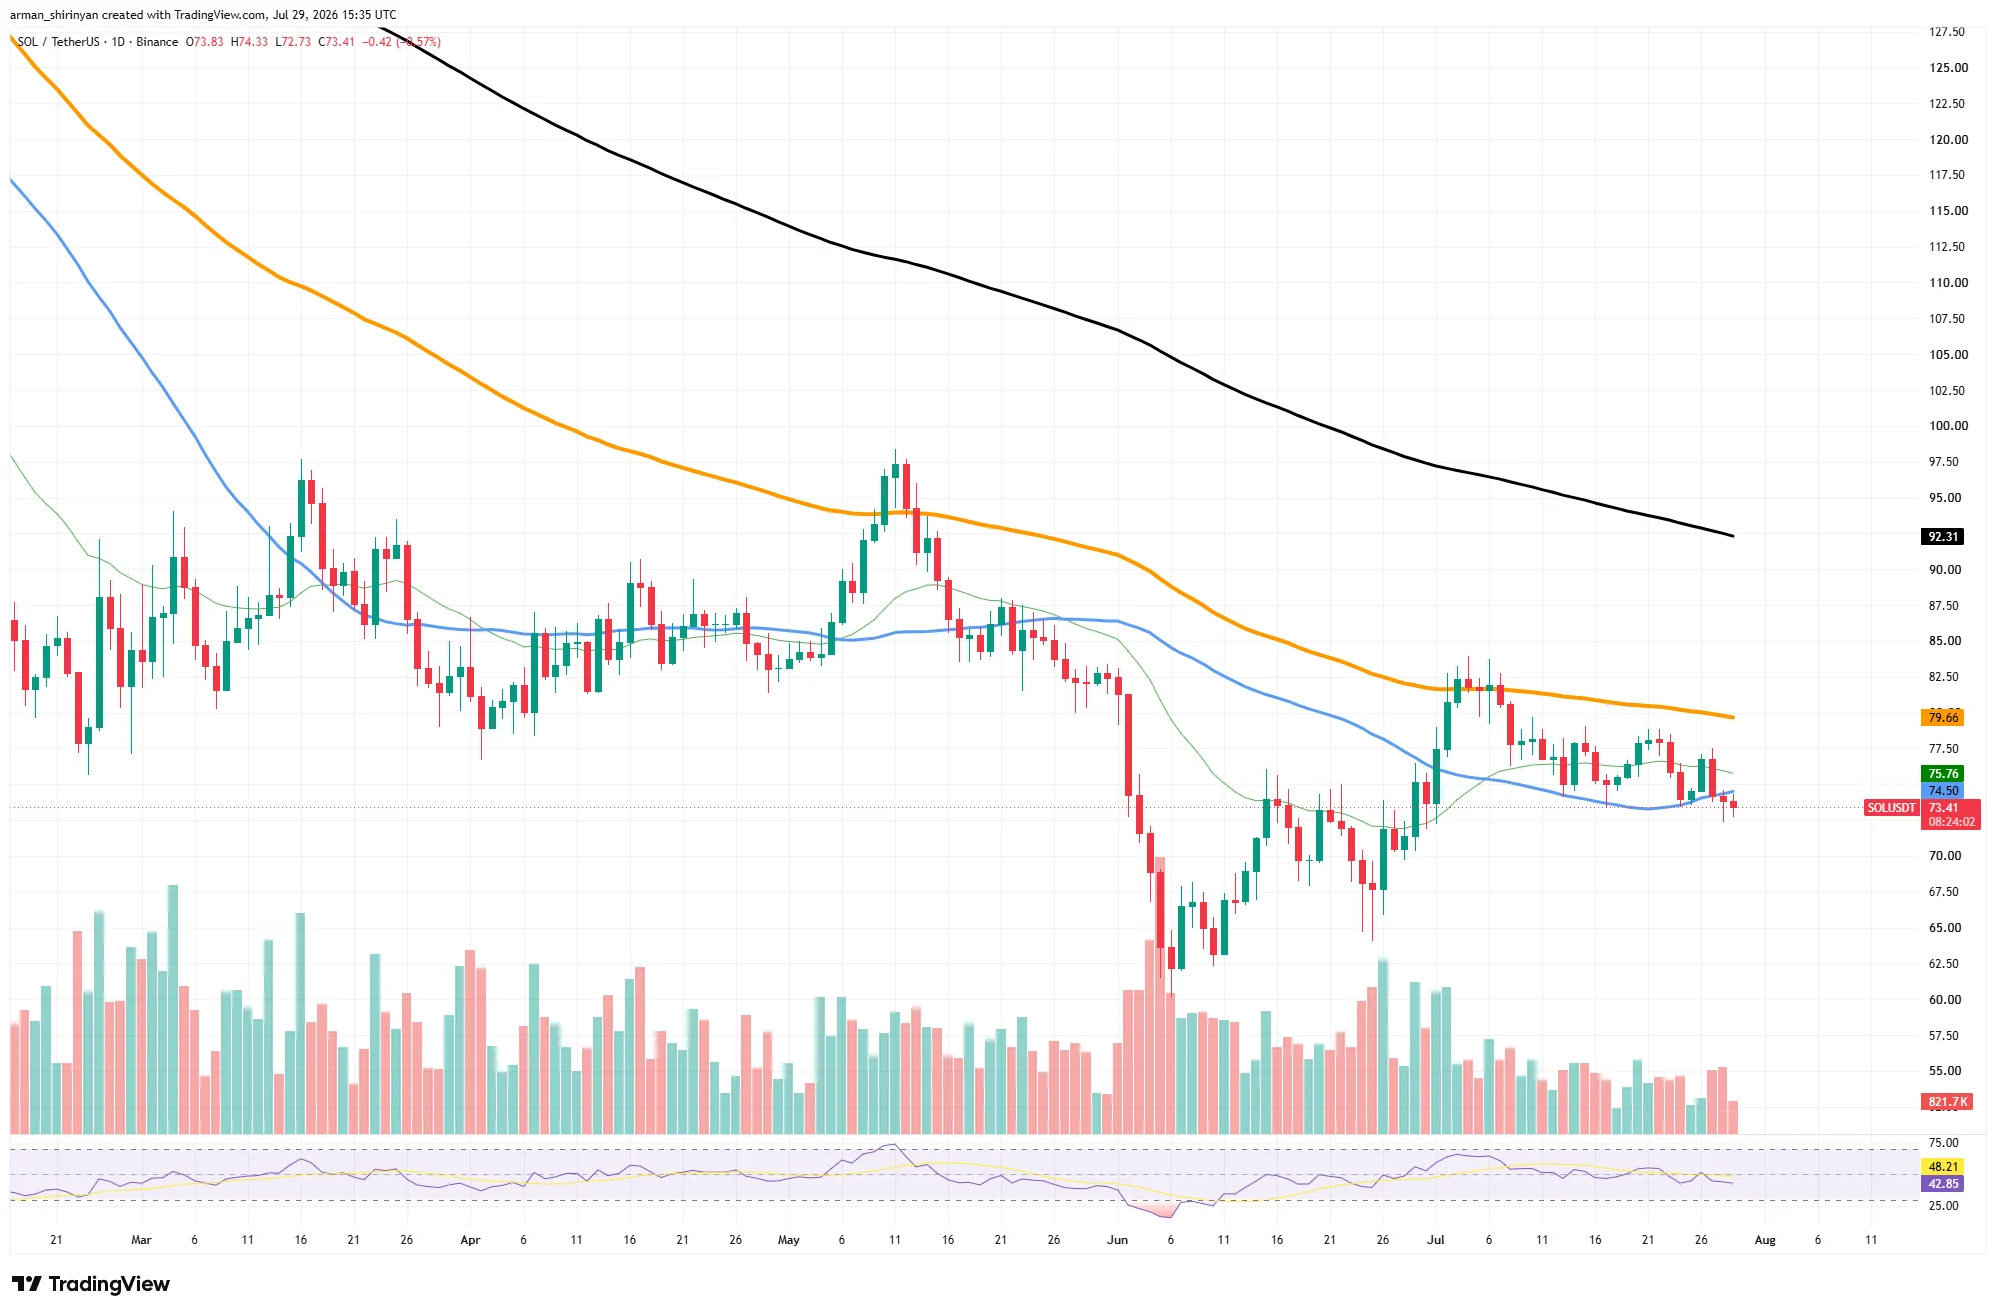
Solana has recently fallen back to around $73, breaking below its 100-day moving average again. The article points out that this level had previously acted as support, and its re-breakdown indicates that selling pressure has not yet eased significantly.
- The 100-day moving average is around $74.5.
- The 50-day moving average is around $75.7.
- The 200-day moving average is close to $79.6.
The article argues that without a stronger market recovery, it will not be easy for SOL to continuously recover these levels. After the sharp drop in June, although SOL rebounded several times, the overall highs in July were still lower, indicating that funds were more inclined to use the rebounds to reduce their positions.
The first support level to watch in the short term is around $72. If this level is breached, the price may retrace further to the $68-$70 area. For the trend to improve, SOL needs to first recover and move back above the 50-day and 100-day moving averages.
ZEC is approaching long-term support.
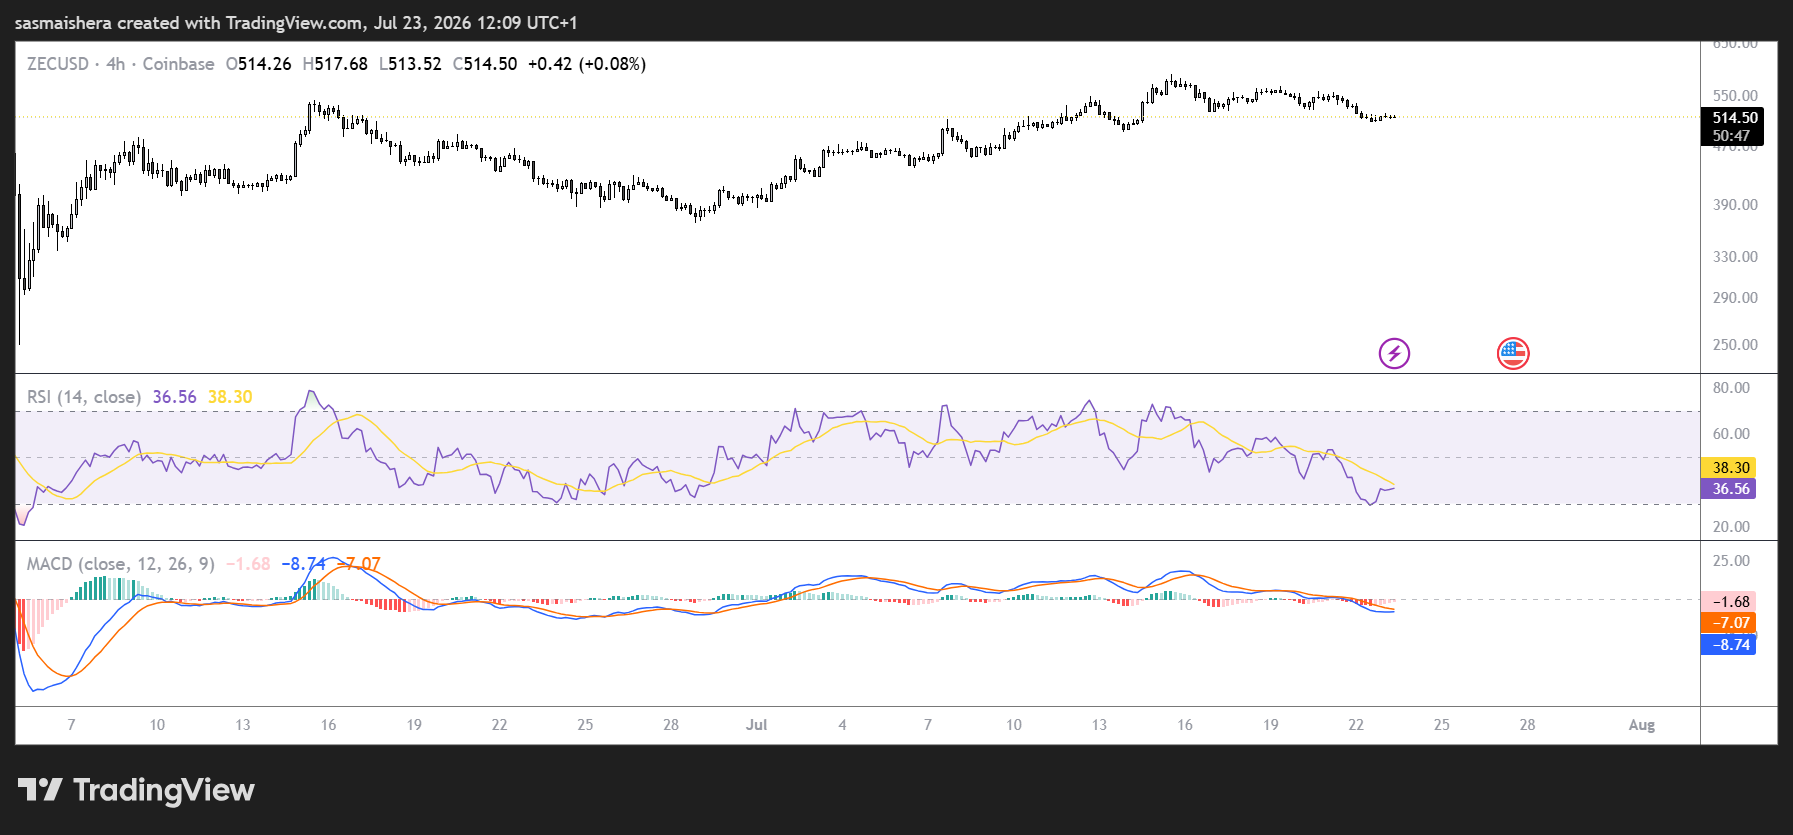
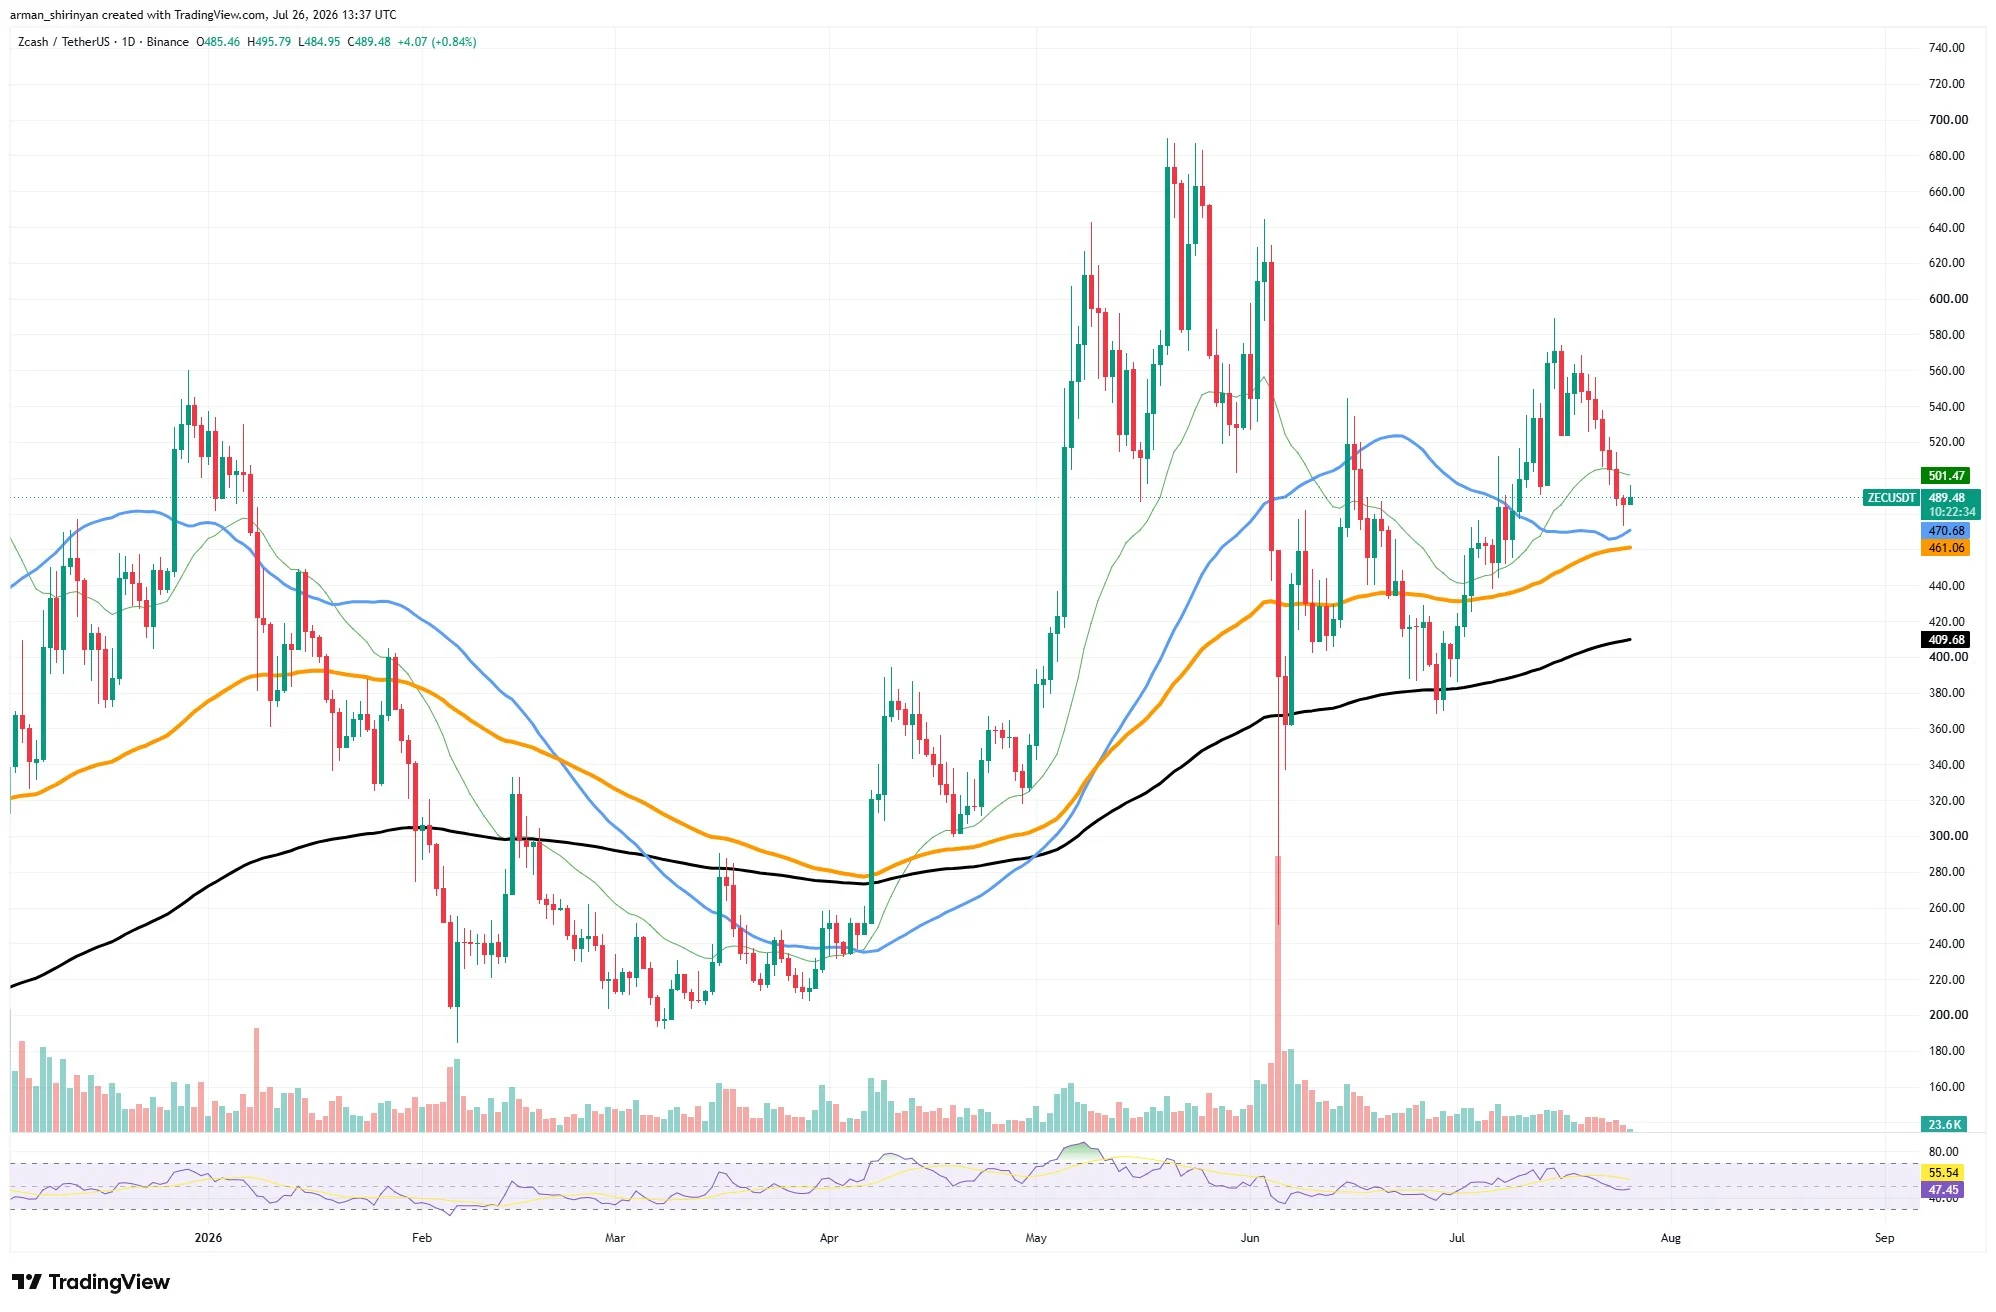
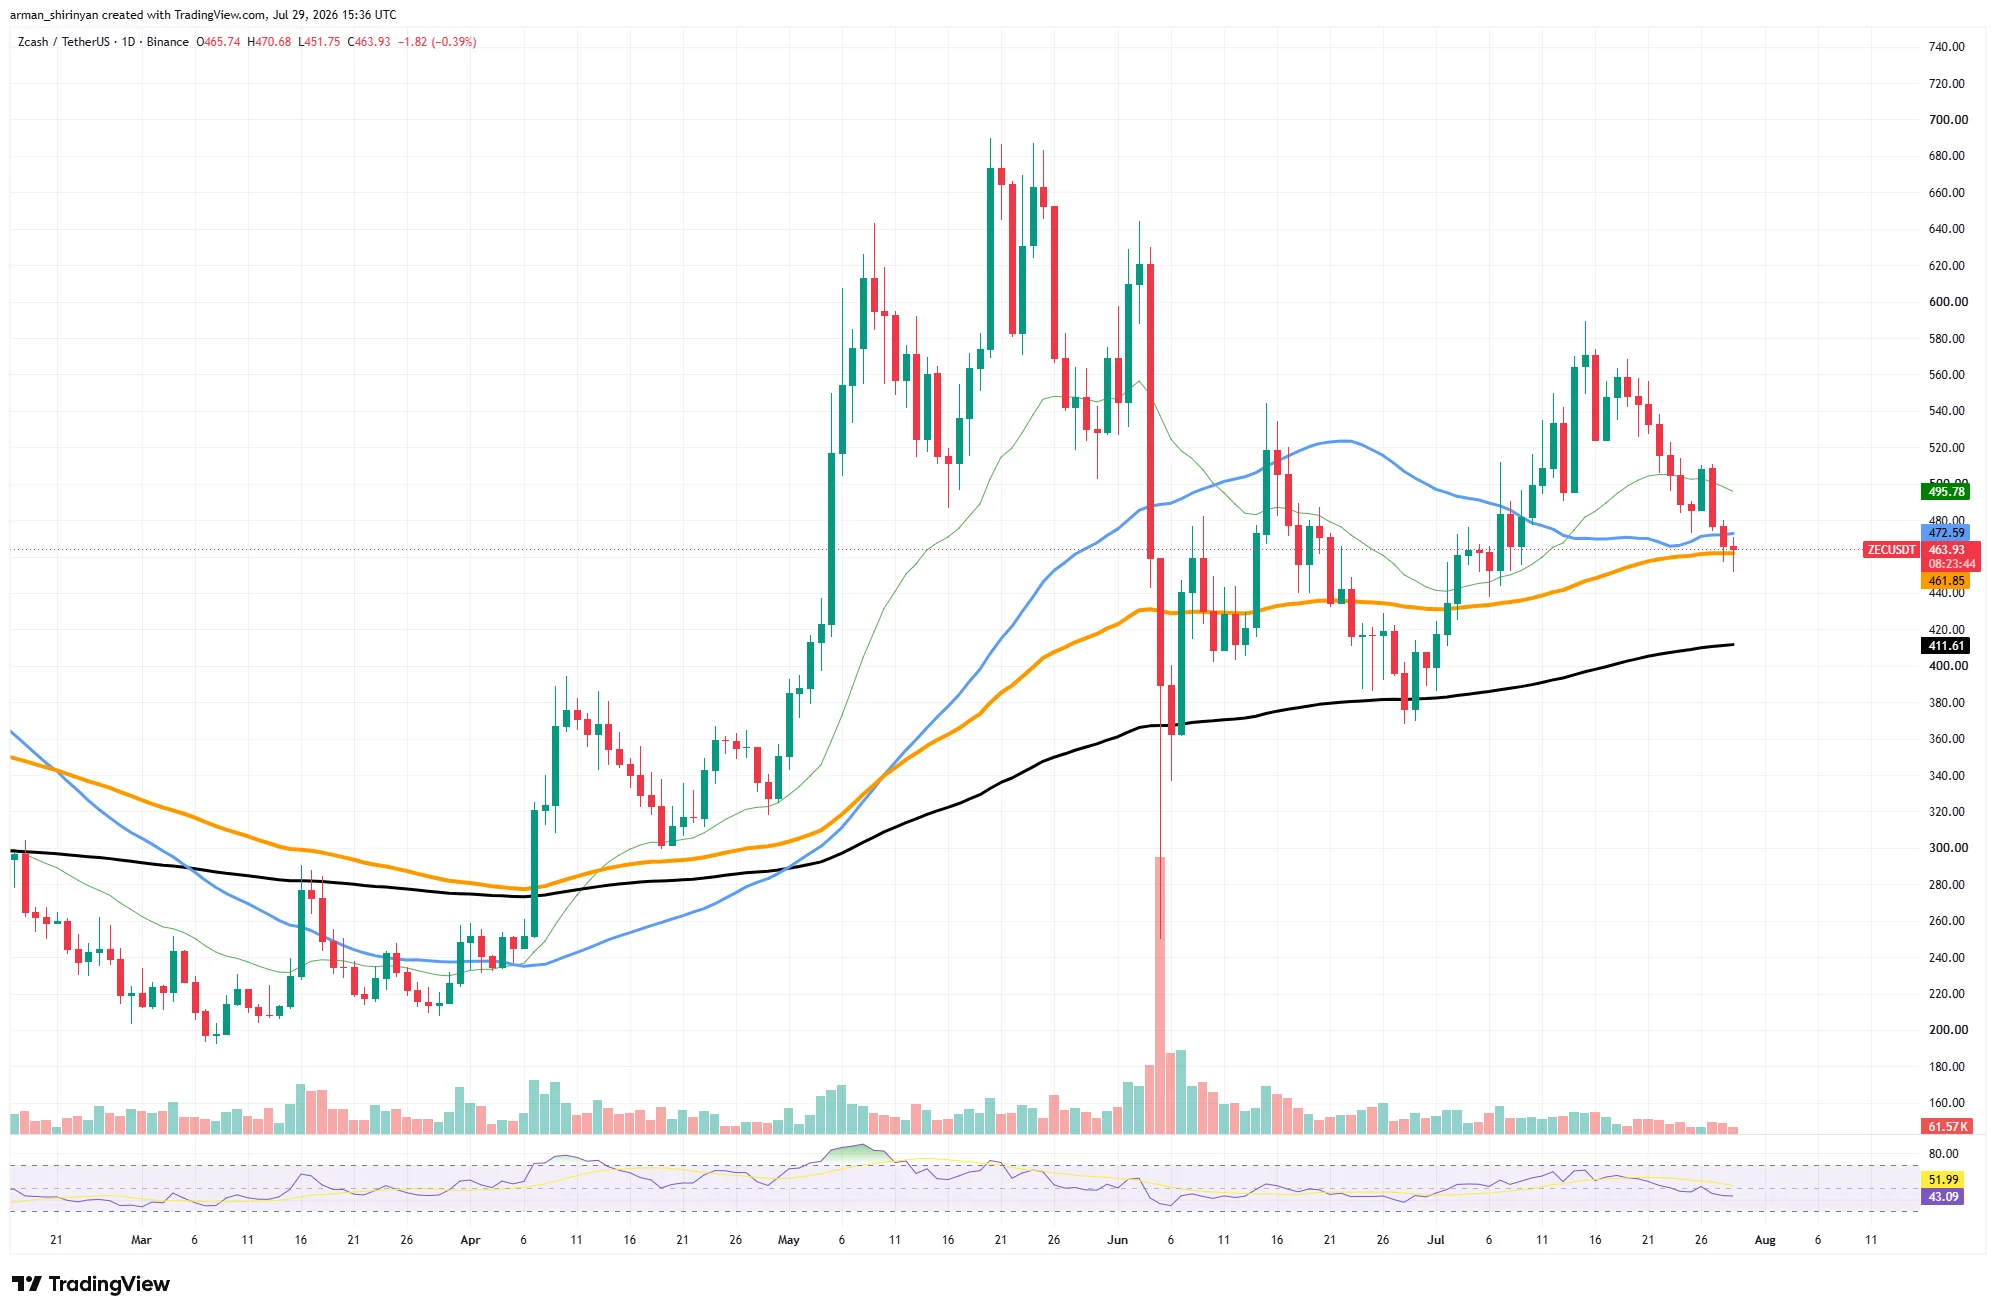
Zcash has weakened significantly after its July rebound and has now fallen back to around $462. The article points out that ZEC has broken below its 50-day and 100-day moving averages, and the market is retesting a more critical long-term support area.
- Current price: approximately $462
- The 50-day moving average is approximately $495.
- The 200-day moving average is approximately $411.
The article notes that the ZEC had previously risen to nearly $570, but subsequently experienced consecutive lower highs and lower lows, indicating weakening buying power. At the same time, trading volume was significantly lower than in June and early July, reflecting a reduction in follow-up buying after the previous rebound.
If the current area fails to stabilize, market attention may shift to the $410 level. The article argues that this level represents the strongest long-term technical support on the chart and could determine whether ZEC continues its recovery or enters a longer period of consolidation.
Bitcoin remains range-bound
Bitcoin is currently fluctuating around $64,000. The article argues that while BTC has recovered some ground from the sharp drop in June, the overall structure remains unclear because the price has not yet regained its position above the 50-day and 200-day moving averages.
The article mentions that BTC previously fell from above $80,000, reaching a low of nearly $59,000, before gradually forming higher lows. The 100-day moving average is currently around $63,300, providing support in recent trading days.
However, upward pressure remains significant, with key support at $63,000 to $64,000 and near-term resistance around $65,500. The 50-day moving average is around $67,500, and the 200-day moving average is around $73,200.
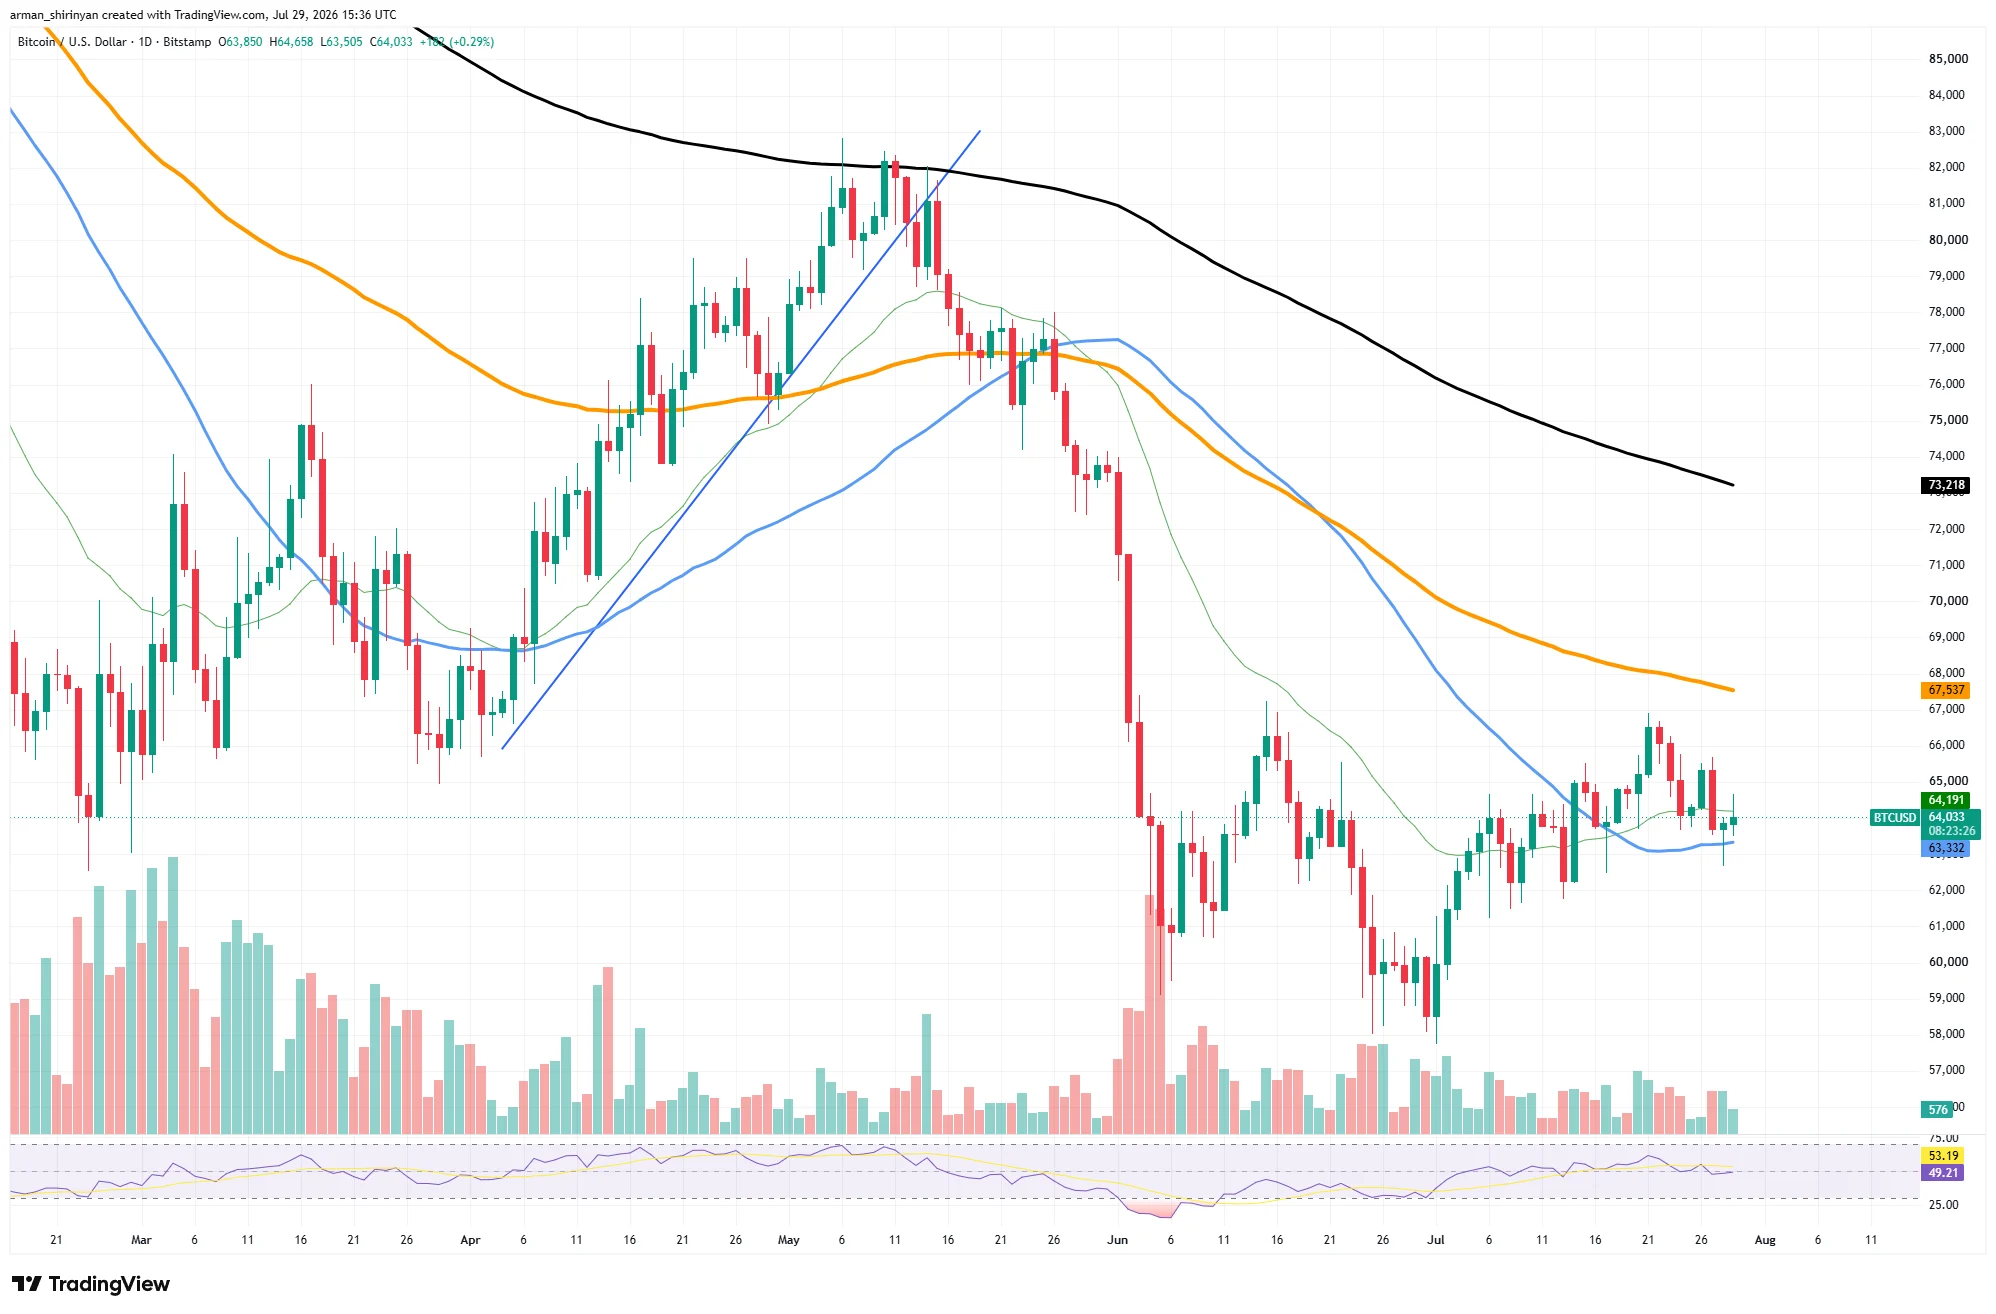
The article argues that current trading volume is significantly lower than during the panic selling in early June, indicating that neither bulls nor bears have gained an overwhelming advantage. The Relative Strength Index (RSI) has rebounded to around 53, suggesting some recovery in momentum, but this is still insufficient to support a sustained breakout.