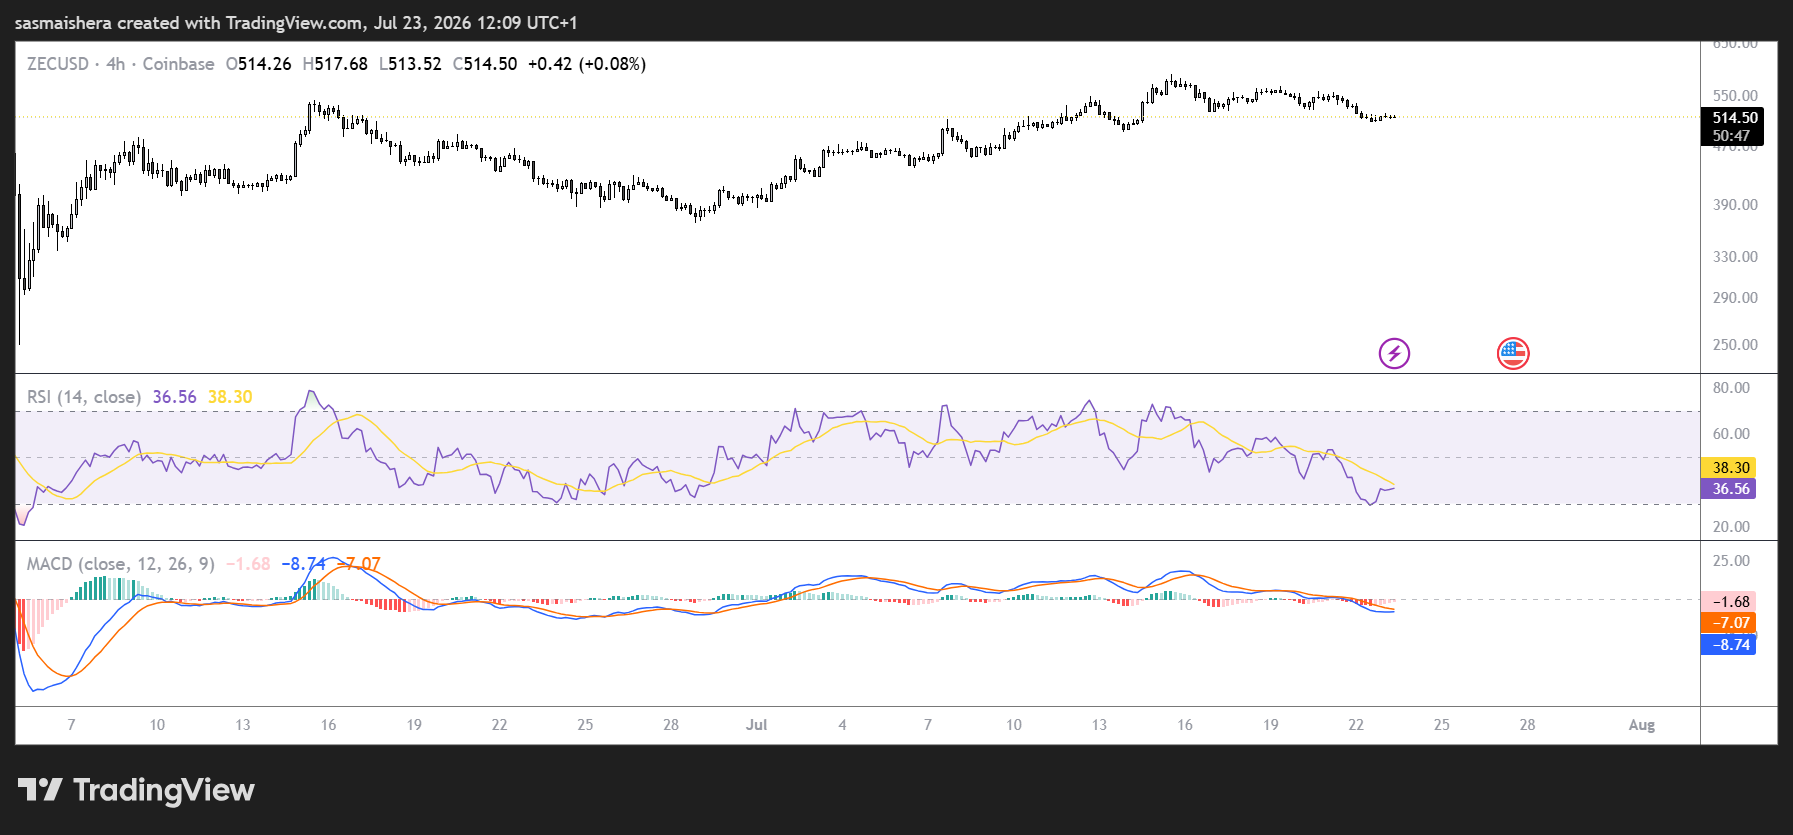
Foreign media analysis suggests that Zcash (ZEC) remained weak on July 24, with the price closing at $494.59. While the daily chart structure is not yet fully broken, short-term rebounds continue to face pressure, and market sentiment remains cautious.
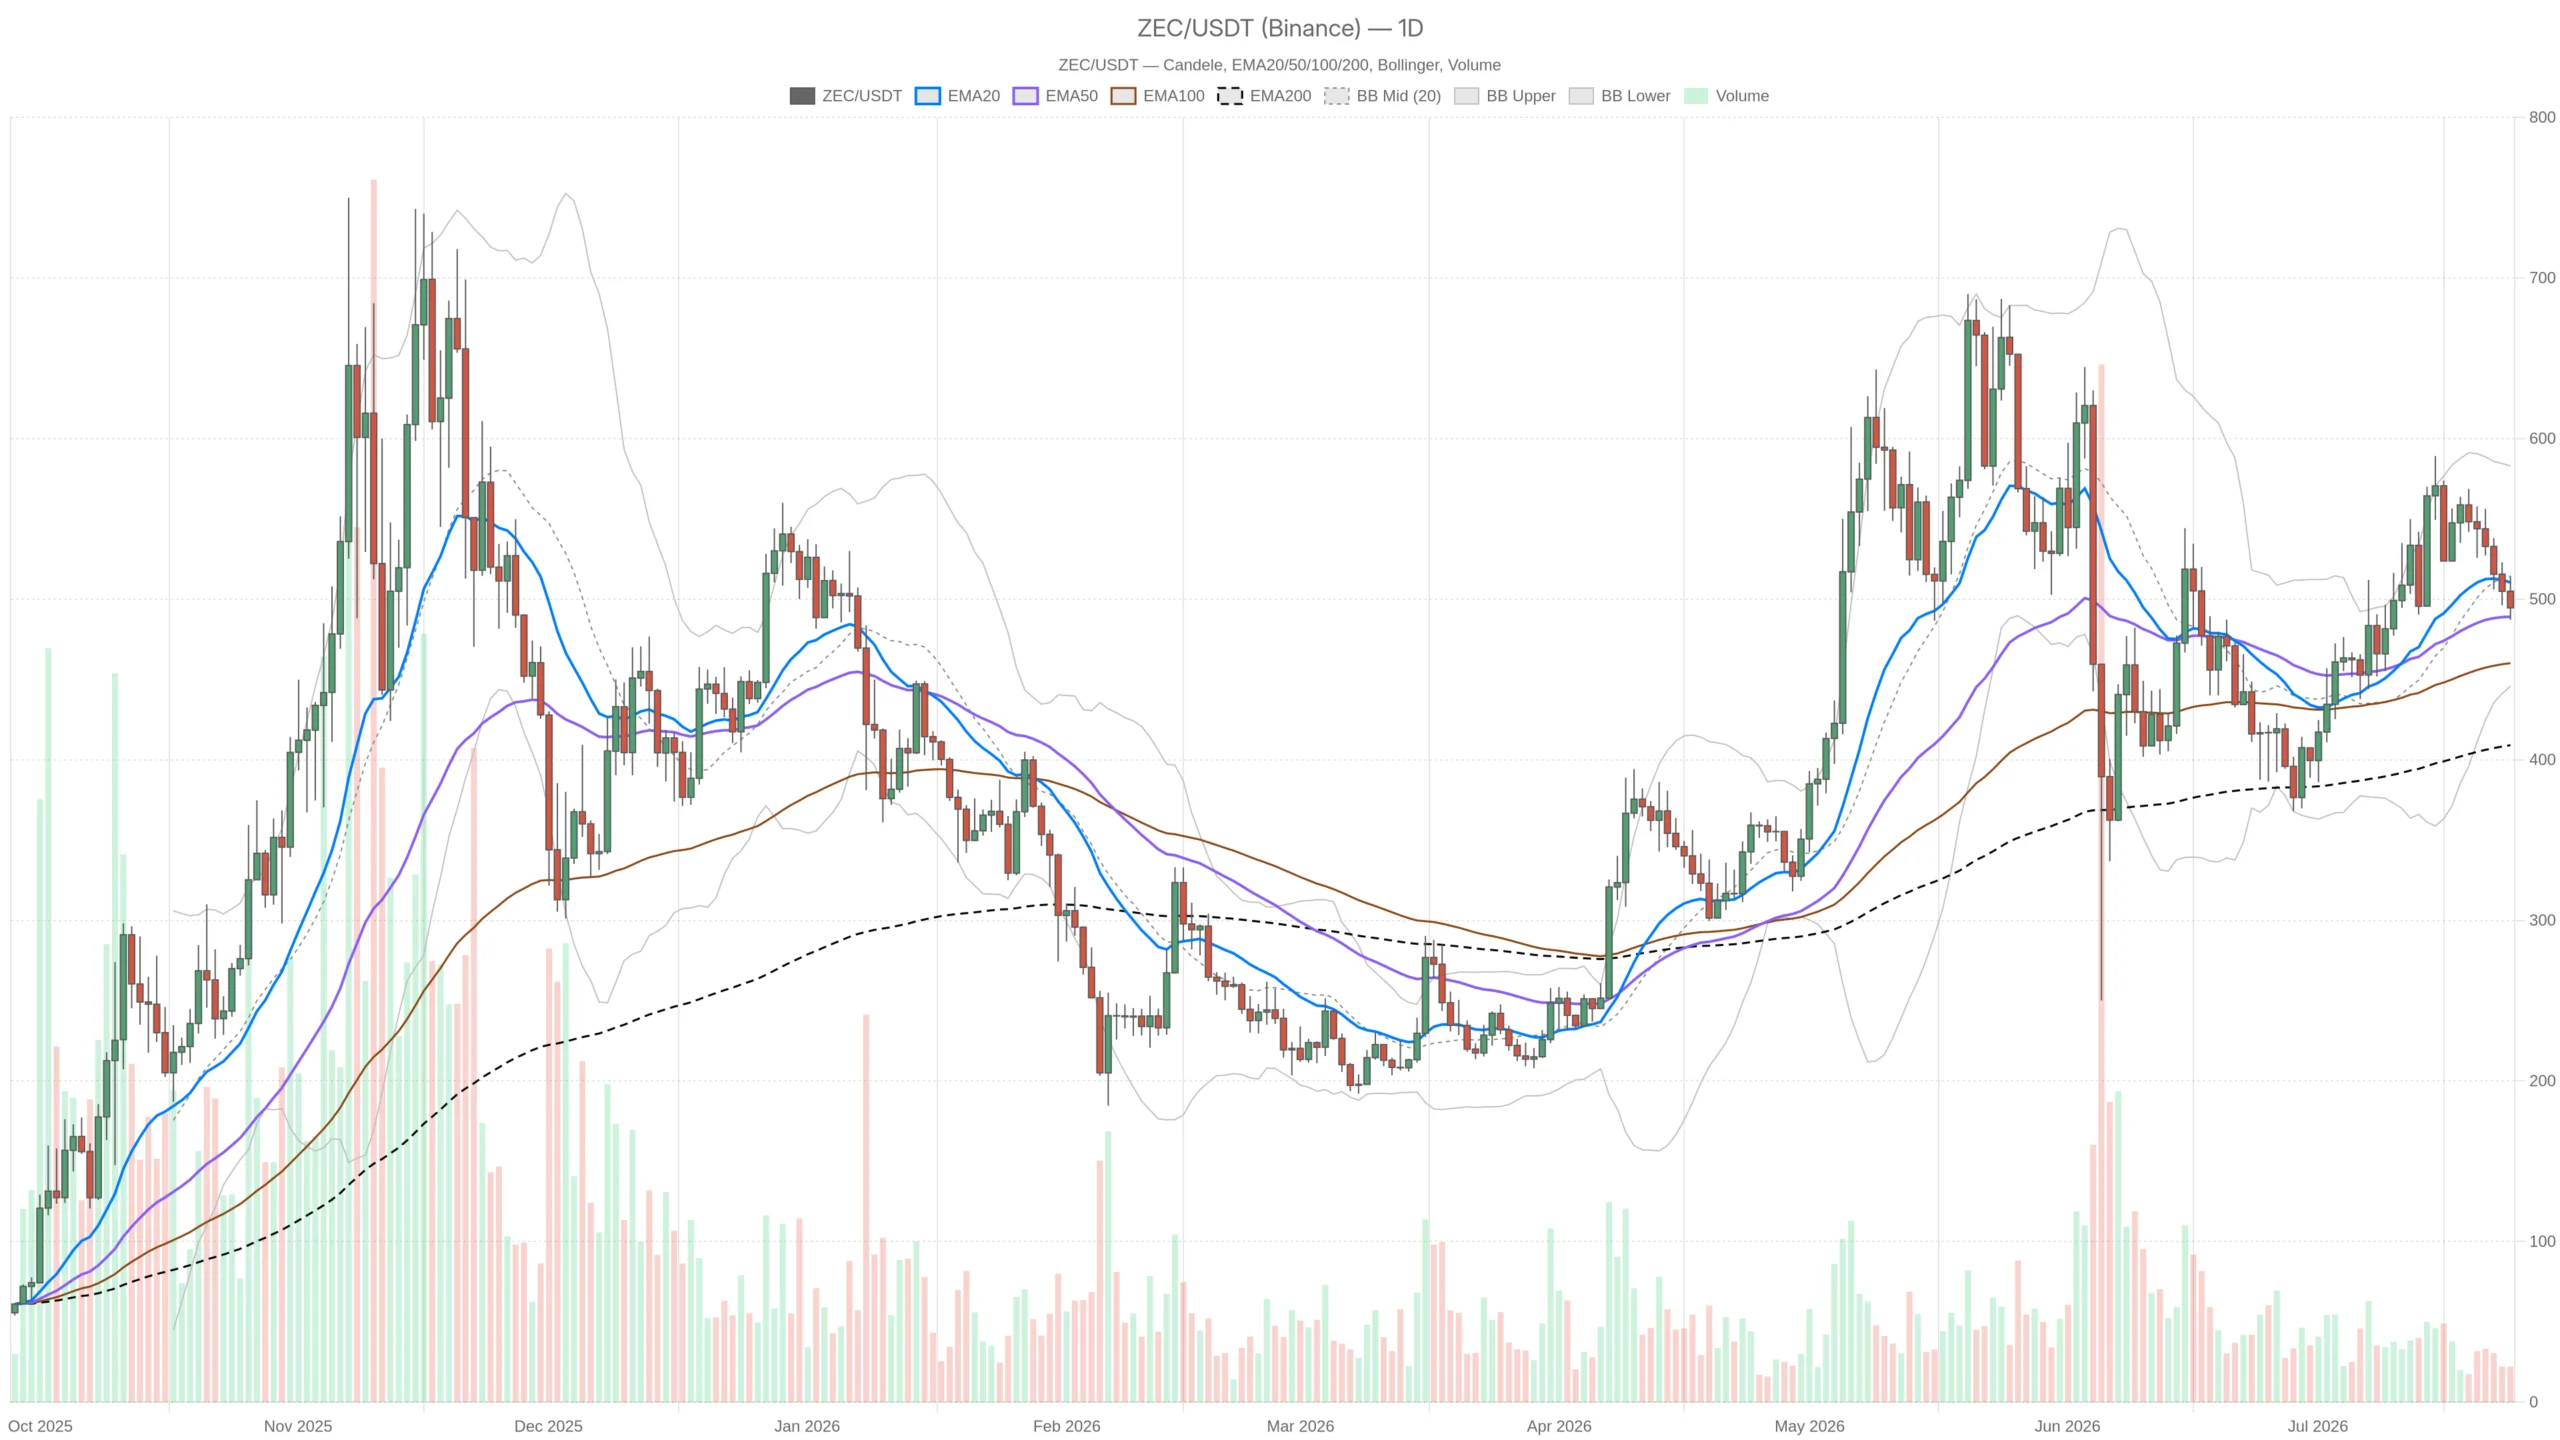
The daily chart remains in a neutral range.
From a daily chart perspective, ZEC is currently below its 20-day moving average at $510.36, but still above its 50-day moving average at $489.04. This means the price remains trapped between two key moving averages, and the direction is unclear. The 200-day moving average is below $409.08, indicating that the longer-term trend has not yet deteriorated.
MACD data shows that current momentum is still weakening. The daily MACD histogram is -4.97, and the gap between the fast and slow lines continues to widen. The RSI is 48.2, in the neutral to weak range, and there is no obvious rebound in buying pressure yet.
$498 to $510 is the threshold for a rebound.

The article mentions that the daily pivot point is at $498.66, and the current price is still trading below this level, indicating that the short-term momentum remains biased towards sellers. The first resistance level is around $510.19, close to the 20-day moving average area.
- Daily pivot point: $498.66
- 20-day moving average: $510.36
- First daily support: $483.05
For the rebound to be more definitive, ZEC needs to first regain the $498.66 level and then further break through $510.36. Only a return to the upper end of this range will provide a clearer daily chart correction signal.
The bears still have the upper hand on the hourly chart.
The short-term structure is more bearish. On the 1-hour chart, ZEC is below the 20-hour, 50-hour, and 200-hour moving averages, indicating that the bears still control the market. The 1-hour RSI is 36.33, which is close to oversold but has not yet entered the extreme range.
The MACD histogram on the 15-minute chart has turned slightly positive, indicating that immediate selling pressure has eased. However, all short-term moving averages are still above the price, and the RSI is only at 46.11, which is not enough to confirm a trend reversal.
The $489-$491 range has become a key support level.
The article argues that the current scenario is more bearish. If the price breaks below the lower Bollinger Band on the 1-hour chart at $491.60, the next potential test is the daily S1 support at $483.05. If the daily close falls below the 50-day moving average at $489.04, the daily chart structure may shift from neutral to bearish, with a further target of the $445 area.
- Near-term support: $491.60
- Key moving average support: $489.04
- Support levels: $483.05, $445
Conversely, if the daily chart effectively recovers the 20-day moving average of $510.36, the aforementioned bearish sentiment will significantly weaken. Currently, the $489 to $498 range remains the core area of the tug-of-war between bulls and bears.
Additional information:The article also mentions that the Fear & Greed Index is 28, indicating that the market as a whole remains defensive; the high Bitcoin dominance also makes it difficult for mid-cap altcoins to break out of their independent strong trend in the short term.