













SHIB The bear market rebound is weakening.
SOL A death cross is not necessarily dangerous
XLM or current rebound signal
The crypto market remains under pressure, with Bitcoin falling to a four-month low of around $62,000 on November 15. SHIB, SOL, and XLM all hit new lows on November 14, but the volume of sell orders is still far below previous peaks. The oversold RSI readings suggest that the market may be approaching a rebound, although fundamental catalysts are still lacking.
SHIB The bear market rebound is weakening.
The good news is that the bear market rebound of Chai Dog Coin SHIB may weaken faster than expected. Following the latest red K-line, there was no surge in selling volume, which could indicate that prices are expected to reverse.
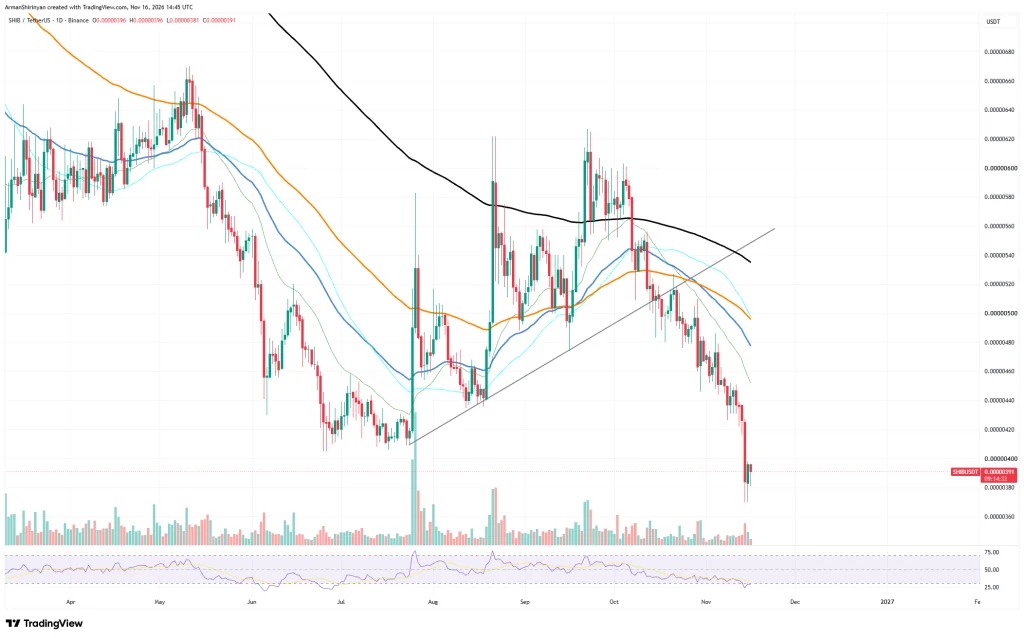
On November 14th, a daily chart broke down SHIB below the July low of $0.0000041, with the shadow line reaching as low as $0.0000037. As of press time, the asset was trading at $0.00000387, marking the lowest level since March. The volume of sell orders on that day was still significantly lower than the peaks seen in late July and August.
Usually, when prices fall to such a bottom, areas where demand previously increased can become additional sources of selling pressure. For SHIB, this area is where buying orders intervened in July.
If we look at the 4-hour chart, we can clearly see a divergence between price and volume, which is a positive sign for the bulls. The moving averages are beginning to diverge, so a quick short-term rebound is not very likely at this time. However, at the RSI on the daily chart, the market is in an oversold area, which also makes a faster recovery possible.
SHIB is currently below all moving averages, with the 200-day exponential moving average ( EMA ) around $0.0000054. Bitcoin fell to a four-month low of around $62,000 on November 15th, which also did not provide any support.
SOL A death cross is not necessarily dangerous
Although the death cross on the chart has been confirmed, it is likely not to be decisive. The price performance is weak in any case, but this will not add more fuel to the bears.
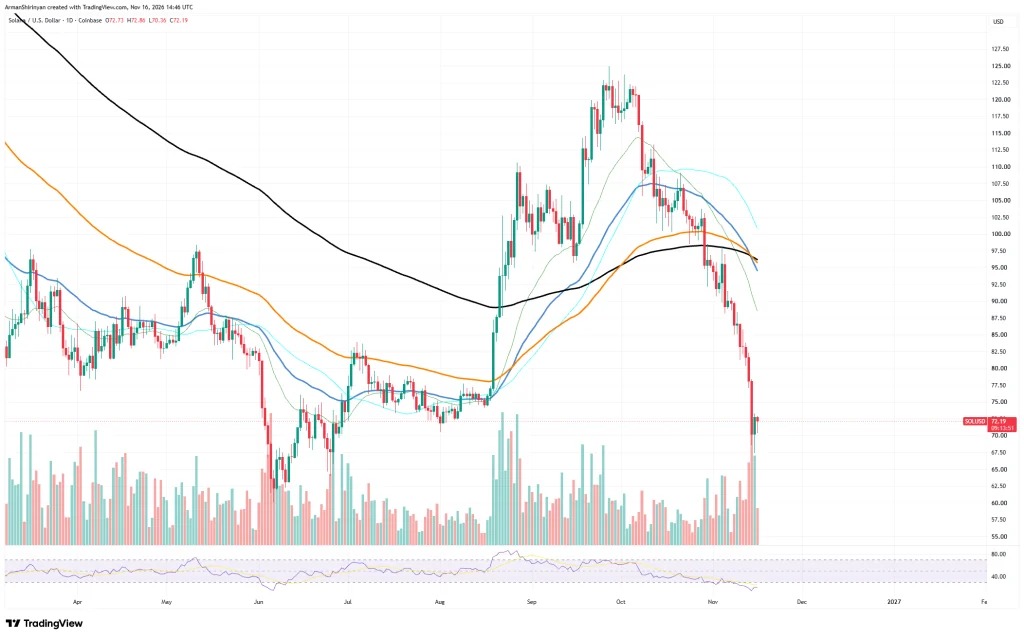
This crossover formed around $96, when a shorter-term moving average fell below the 200-day EMA, and another moving average was also about to follow suit. After dropping to around $67.50 on November 14th, SOL is currently at $71.70. Since reaching a high of nearly $125 in late September, Solana has fallen by more than 40%.
Firstly, the death cross is not as frightening as it used to be. Secondly, this signal itself is lagging and only reflects information that has already been incorporated into the price. For those looking for entry points, it serves more as a reference.
The chart indeed shows a weak trend, but similar to SHIB, the first downward trading volume bar in a long time has appeared during the bear market rebound. Although this is just a single candlestick, it could be the beginning of a rebound.
The price is already in a state of oversold, but the bottom may be closer to $62, and RSI also supports this judgment. Going back to June, $62 was exactly the level where SOL hit its bottom before the summer rebound.
XLM or current rebound signal
Stellar has reached a potential bottom in price, and perhaps it will finally find support for a rebound. The trading volume is relatively low, but the main issue remains the lack of fuel for a supportive rebound.
After falling to $0.13 on November 14, XLM is currently trading at $0.1384, which is below its low of around $0.142 in May; whereas in June, XLM soared from this range to around $0.30. During the decline, RSI once fell below $30. Since reaching a high of nearly $0.235 in late September, XLM has dropped by about 40%, yet the volume of sell orders is still far lower than the peaks seen in June and July.
The short-term moving average is crossing below the long-term moving average, and the problem here is that this indicates a further deterioration in the short term. Currently, all moving averages are above the price level, with the 200-day EMA around $0.184.
The upcoming XLM update on November 23 is most likely already factored into by the market, and it is unlikely to fundamentally change the price direction. The Protocol with the code name Bell will submit its mainnet validator votes on that day.
This upgrade adds post-quantum signature checks and the muxed address for the Soroban smart contract, and also prepares for faster ledger times. This upgrade has been running on the test network since early November.
The key remains whether the entire crypto market can recover.