













Bitcoin fell to around $67,200 on November 14th. As the price has remained below $70,000, it has lost more than 10% so far this week and has also fallen below the 200-week moving average.
Bitcoin is trading below the 200-week moving average of $67,992, and the weekly candlestick has not yet closed.
The daily chart RSI has dropped to 22.96, and the price has also fallen below the lower band of the Bollinger Bands.
American Bitcoin ETF saw a total outflow of approximately $1.44 billion over five trading days as of November 11.
Merlijn The Trader indicates that after Bitcoin falls below $70,000, he will place a buy order around $66,000.
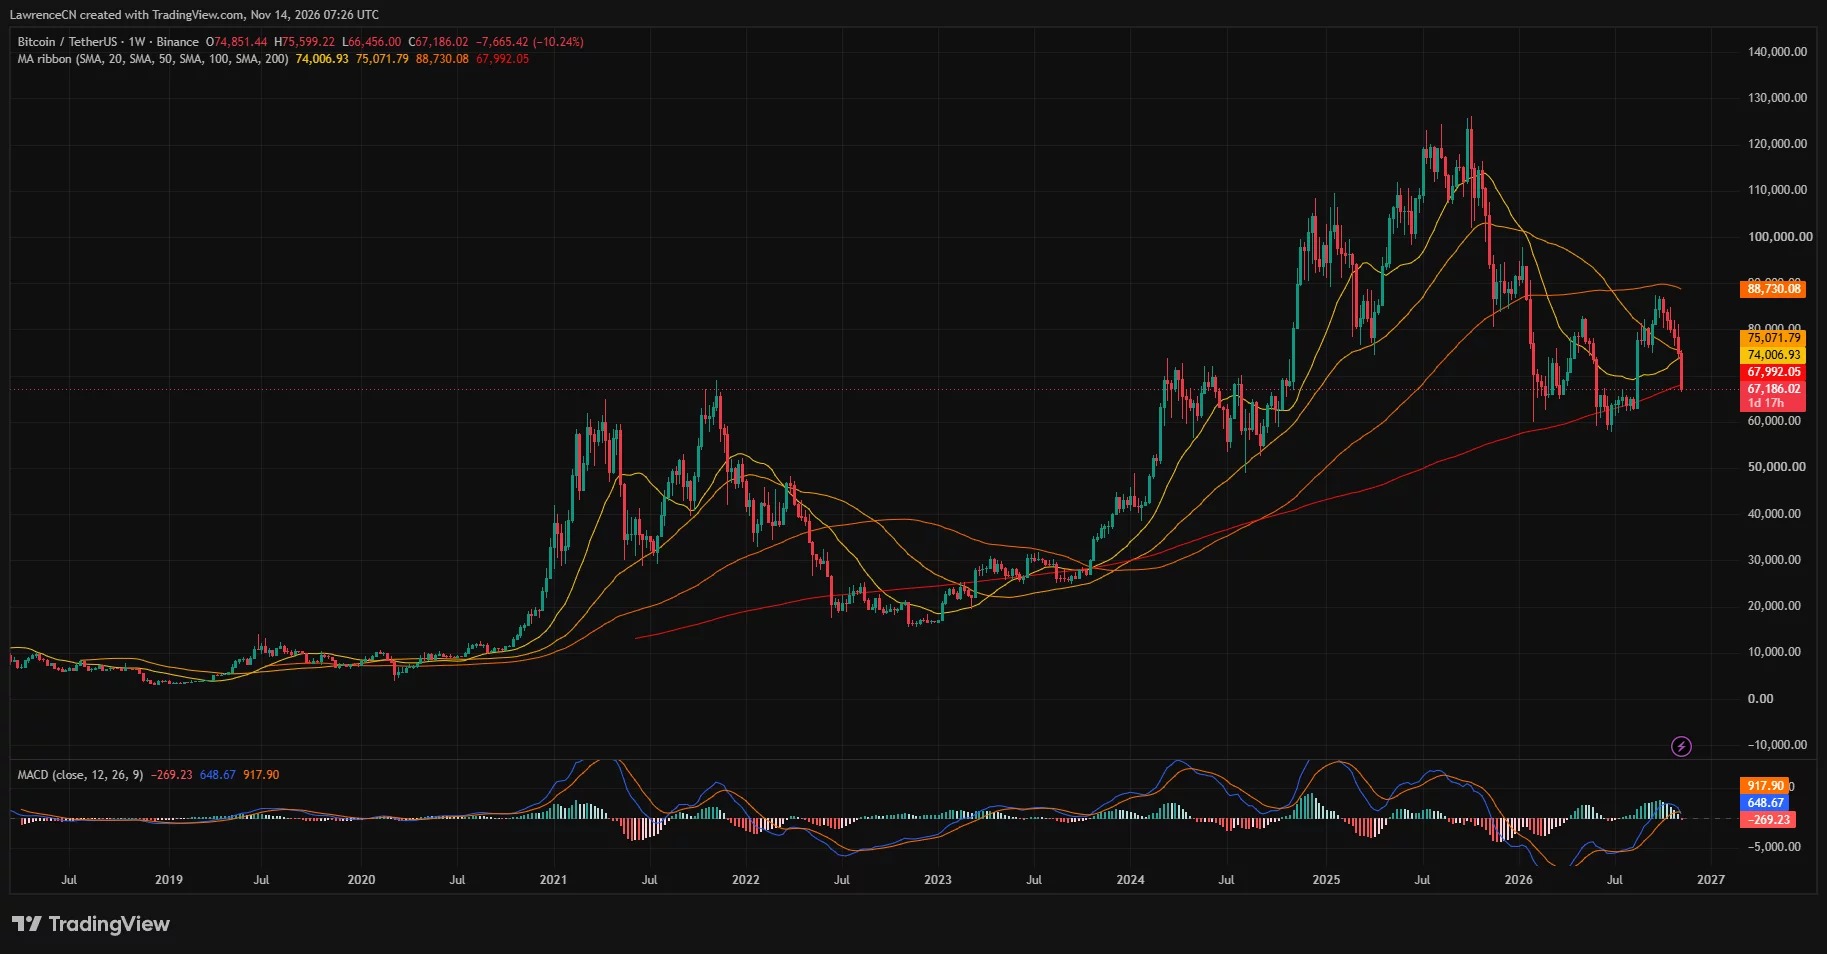
As shown in the charts of TradingView / USDT, Bitcoin touched $66,456 on November 14 before rebounding to around $67,194. The daily candlestick chart showed a 1.64% decline, while the weekly chart indicated a 10.24% drop from the opening price of nearly $74,851.
Bitcoin falls below the 200-week moving average
On the weekly chart, Bitcoin's 200-week simple moving average is at $67,992, with the price being approximately 1.2% below that line. Since the candlestick has not yet closed, this screenshot shows a price drop below the moving average this week. Whether this drop is confirmed will depend on the final closing price of the week.
The 20-week and 50-week moving averages are much higher, at $74,007 and $75,072 respectively. Both are currently above the current price level, and the 100-week moving average is also at $88,730.
As the price falls, the momentum on the weekly chart is also weakening. The Moving Average Convergence Divergence (MACD) indicator shows that the MACD line is at 648.67, which is below the signal line of 917.90, and the bar chart indicates a negative value of 269.23 points.
In a post on November 14th, trader Merlijn The Trader emphasized the breakdown in the range of $73,000 to $70,000, as well as the importance of the weekly closing price. His post mentioned that the 200-day moving average was broken down, which is a different indicator from the 200-week moving average on the weekly chart.
“Most people will sell in pain. I will buy at $66,000,” he wrote.
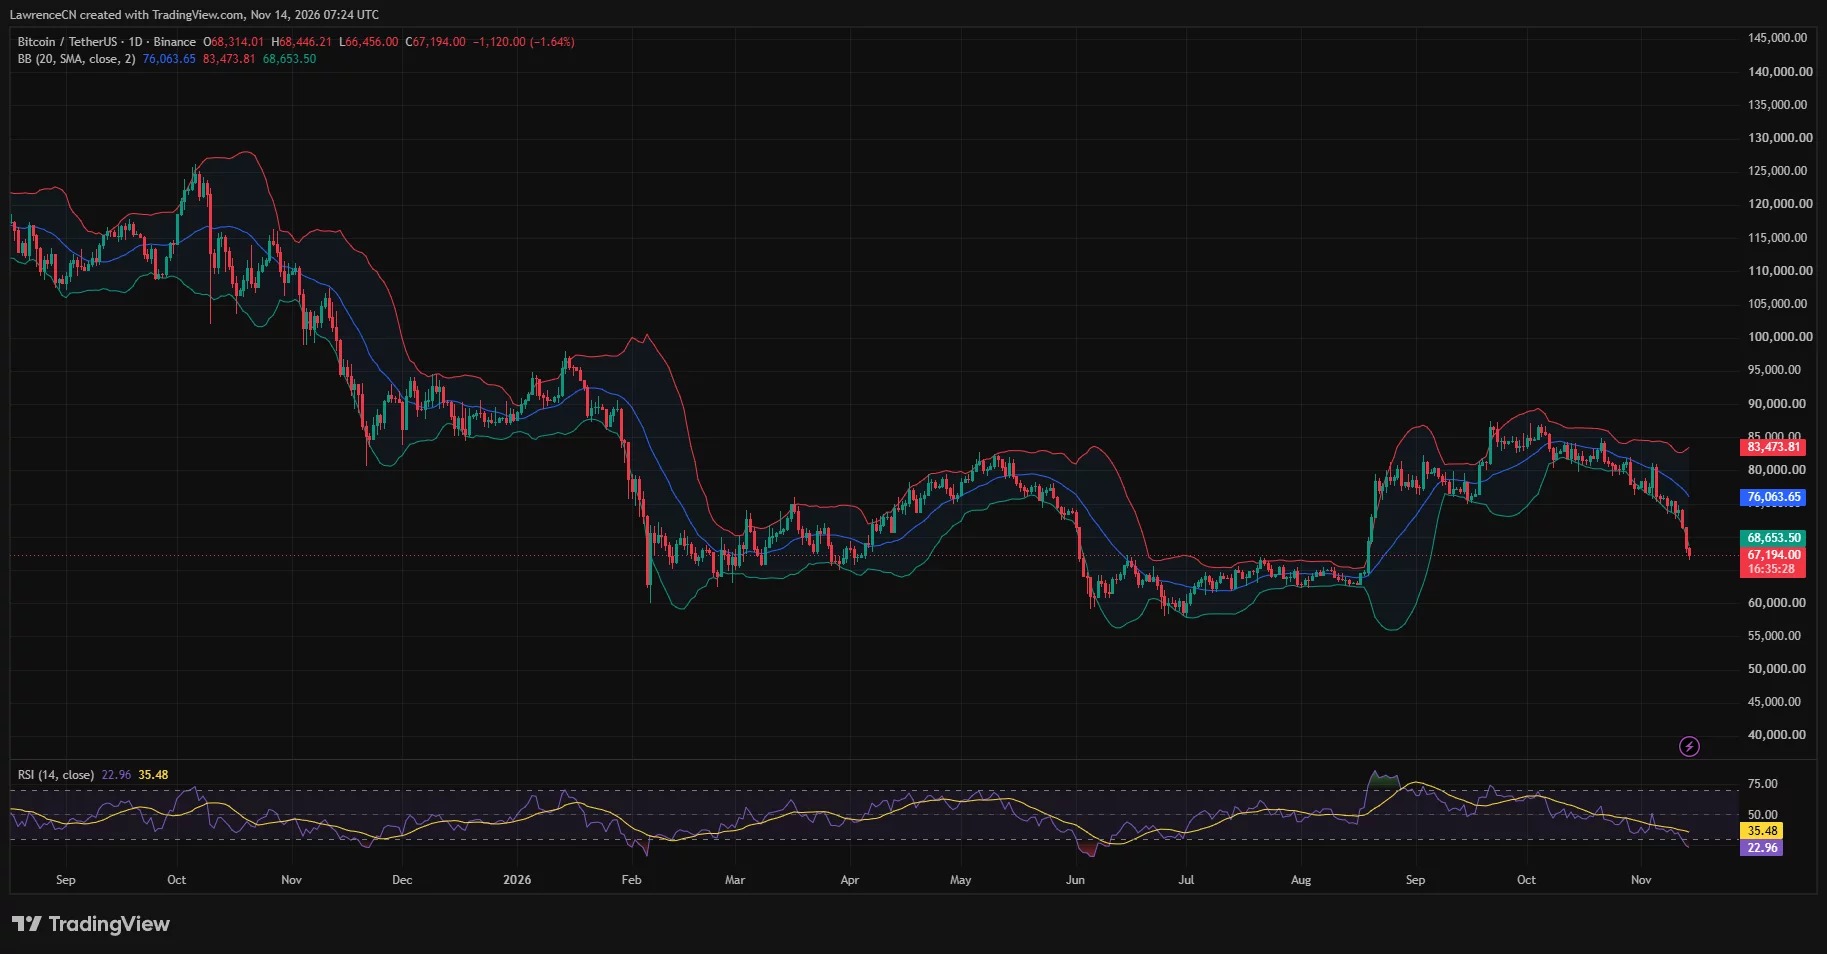
The intraday low was $730 lower than the price shown in the daily chart screenshot. Compared to the opening level of the weekly chart, this low represents a decline of approximately 11.2%, a figure calculated based on the data indicated by Binance.
Daily chart RSI breaks below 23, selling pressure accelerates
The Bitcoin daily relative strength index is 22.96, which is below the usual oversold threshold of 30. However, its RSI average remains above that level at 35.48.
The price has fallen below the lower band of the Bollinger Bands at $68,654, while the 20-day middle band is at $76,064 and the upper band is at $83,474. The expansion of the Bollinger Bands coincides with the appearance of several recent large negative candles.
Overselling readings may be accompanied by a rebound, but it does not indicate that the selling has come to an end. On this chart, Bitcoin has neither regained the lower trend line nor returned above $70,000.
The lower track and the 200-week moving average form a reference level for a rebound in the vicinity, around the range of $68,000 to $68,650. At higher levels, the weekly moving average near $74,000 to $75,100 is close to the middle band of the daily Bollinger Bands, bringing multiple technical indicators together in the same upper area.
Despite a temporary easing in inflation data, the outflow of ETF funds continues.
This round of decline occurred after another wave of institutional capital withdrawal. crypto.news previously reported that, according to SoSoValue data, US spot Bitcoin ETF recorded a net outflow of approximately $1.44 billion over the five trading days ending November 11.
Among them, IBIT of BlackRock accounted for $269.73 million of the $299.9 million that flowed out on that day. However, since the launch of these funds in January 2024, the cumulative net inflow has still been positive, reaching $55.1 billion.
In previous sell-offs, derivatives traders suffered heavy losses. Data cited by CoinGlass in a report on November 13 showed that the total amount of leveraged liquidations of crypto assets within 24 hours reached $1.47 billion, of which long positions were liquidated for $1.31 billion, accounting for about 89% of the total.
In October, consumer inflation rose by 0.4% month-on-month, higher than the expected 0.3%. The producer inflation data released on Friday provided some relief: the monthly PPI increased by 0.3%, lower than the expected 0.4%. Following the release of this data, Bitcoin briefly rebounded to around $70,000, but charts on Saturday showed that it weakened again thereafter.
The liquidation-intensive area is still above the Bitcoin price.
On the right side of the chart, the visible clearing concentration areas are still around $72,000 to $73,000 and $75,000 to $78,000. There is also a larger range at around $82,000 to $83,000. These are estimated clearing exposures, not confirmed buy orders, nor are they guaranteed price targets.
The lower limit of the range shown in the chart is close to $64,362, therefore, more information regarding leveraged positions below that price cannot be provided.
Disclosure: This article does not constitute investment advice. The content and materials on this page are for educational purposes only.