












Under the combined pressure of continuous withdrawals from US spot exchange-traded funds (ETFs), heavy leverage liquidations, and new geopolitical concerns, cryptocurrency prices came under pressure ahead of the release of the US inflation report on Tuesday, with Bitcoin falling below $75,000.
According to the price data from crypto.news, Bitcoin approached $74,500 on November 9th, a decrease of about 2% from 24 hours prior. It had previously rebounded after falling to a low of around $73,700 on Sunday. This cryptocurrency has struggled to maintain its recent rebound, and as soon as the price approaches nearby resistance levels, selling pressure reappears.
In most of last week, institutional capital flows remained in a net outflow, which limited Bitcoin's ability to rebound after the recent decline.
Data from Farside Investors shows that from November 2 to November 6, US spot Bitcoin ETF experienced a net outflow of nearly $1.28 billion. BlackRock's iShares Bitcoin Trust ( IBIT ) accounted for about $1.21 billion of the withdrawals during these five trading days.
Last Friday, there was another net outflow of $411.9 million, of which IBIT experienced an outflow of $403 million. Fidelity's FBTC attracted $42.8 million in inflows on that day, however, the inflows into that single fund were not sufficient to offset the outflows from other funds.
There was a brief rebound on Wednesday of that week, and on that day, Bitcoin ETF attracted $74.6 million in funds. However, subsequent selling pressure erased this improvement, with a net outflow of $430.2 million recorded on Thursday.
Sustained capital outflows have become a focal point of concern for traders paying attention to institutional demand. The redemption of ETF may lead to the sale of Bitcoin through fund settlement arrangements, however, the daily outflow data does not indicate the specific timing of transactions in the underlying market.
crypto.news's assessment of the Bitcoin market on November 7th pointed out that in the context of continuous capital outflows, the $75,000 range is an important level.
As Bitcoin declines, the amount of cryptocurrency liquidations exceeds $1 billion
As market volatility intensified on Sunday, traders using leverage began to experience margin calls, and the downward trend further expanded.
CoinGlass Settlement data cited during the selling period shows that over $1 billion in cryptocurrency positions were closed within 24 hours. Among them, long positions accounted for approximately $931 million of the total. Long positions benefited as prices rose.
The Ethereum liquidation amount was approximately $455 million, and that of Bitcoin was about $278 million. The largest reported single liquidation was a position of ETH valued at around $48 million.
Liquidation occurs when the collateral for a leveraged position is insufficient to meet the requirements of the exchange. Subsequently, the exchange will close out these positions; if multiple traders suffer losses at the same time, this may further intensify the selling pressure.
Bitcoin prices fell to around $73,761 in the early hours of Sunday, but subsequent buying pressure pushed them back above $75,000. However, this rebound was not sustained, resulting in BTC falling below that level again on Monday.
The intensification of the situation in Iran increases uncertainty in the Bitcoin market
As investors assess the stalled negotiations between Washington and Tehran, geopolitical developments have also intensified market tensions.
U.S. Secretary of State Marco Rubio described Iran's demands as "absurd" and said that little progress had been made in negotiations. The remarks came after a new round of uncertainty surrounding the conflict and its impact on energy supplies.
The ongoing tense situation has sparked concerns about oil prices and inflation, especially since disruptions in shipping and energy exports remain unresolved.
During the recent period of market pressure, the price of Bitcoin has been fluctuating in sync with other risk-sensitive assets. However, the current price changes do not indicate how much of the decline on Sunday was directly caused by developments related to Iran.
Investors are currently awaiting the release of the October U.S. Consumer Price Index report, which is scheduled to be published by the U.S. Bureau of Labor Statistics at 8:30 a.m. Eastern Time on November 10th.
Bitcoin faces resistance around $75,600
After Bitcoin recently hit consecutive lower highs and lower lows, technical indicators continue to show weak momentum.
The daily relative strength index is around 34.56, which is lower than its moving average of 39.03 and close to the oversold threshold of 30. This position indicates that the buying momentum is still limited, although the indicator has not yet entered the oversold zone.
Meanwhile, the value of MACD is -1,733.10, which is still lower than the signal line of -1,336.35, resulting in a negative bar chart reading of -396.75.
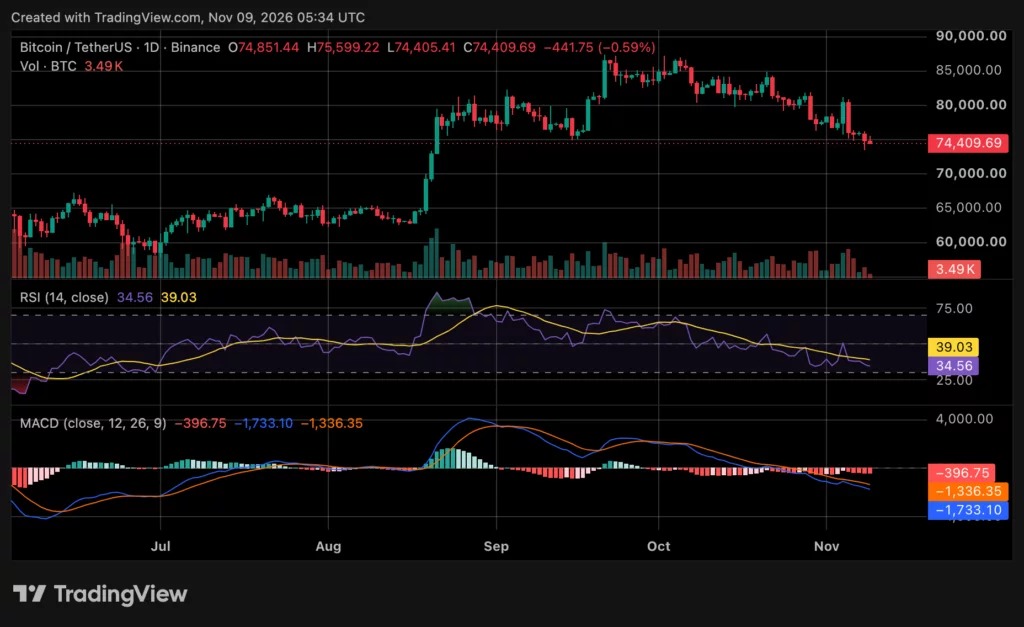
Cryptography analyst Ali Martinez pointed out that Bitcoin managed to hold above the 200-day simple moving average during its recent decline, suggesting that a rebound could follow.
Another assessment by More Crypto Online considers the 50-week moving average as a resistance level, with another level approaching $78,186.
The current trading range shows that around $75,600 constitutes a resistance level, while the recent low of approximately $73,692 remains an area of interest for traders. If the pullback continues, More Crypto Online believes that a lower support range is between $71,252 and $67,868.
Disclosure: This article does not constitute investment advice. The content and materials on this page are for educational purposes only.