











Brief
- Solana ( SOL ) Falls below $100, but sellers still hold the upper hand
- Ethereum ( ETH ) attempts to rebound around $2317
- NEAR Protocol ( NEAR ) Falls below the key moving average
- Zcash ( ZEC ) testing the $1300 resistance level after a rebound
Brief
- Solana ( SOL ): The price has fallen to $92.69 and is below all major moving averages, yet sellers still hold the upper hand.
- Ethereum ( ETH ): The price is close to $2317; it needs to break through $2350 to confirm any rebound.
- NEAR Protocol ( NEAR ): The price is around $4.02, which is below the short-term moving average, with support at $3.80.
- Zcash ( ZEC ): The price is close to $1288; it's necessary to confirm a breakthrough above $1300.
Solana ( SOL ) fell below $100, with sellers taking the lead
Solana ( SOL ) has fallen below the psychologically significant $100 level, and selling pressure continues to increase. Following a strong rally in September that pushed SOL above $120, the token has entered a prolonged correction period, with sellers gaining the upper hand in intraday trading.
As of November 4th, the trading price of SOL was around $92.69, which represents a further decline from the high of around $124 in October.
From a daily perspective, the situation is still deteriorating. The trading price of Solana is below all major moving averages. SOL has also fallen below the longer-term moving average, which was around $98; this moving average served as support during the rebound in September.
This breakdown puts Solana in a vulnerable position, especially after its short-term moving average begins to turn downward.
The range of $98 to $100 has now become the recent resistance level. If this area can be effectively reclaimed, sentiment may improve, allowing SOL to test the $103 to $108 range. As long as prices remain below these levels, the chart remains bearish.
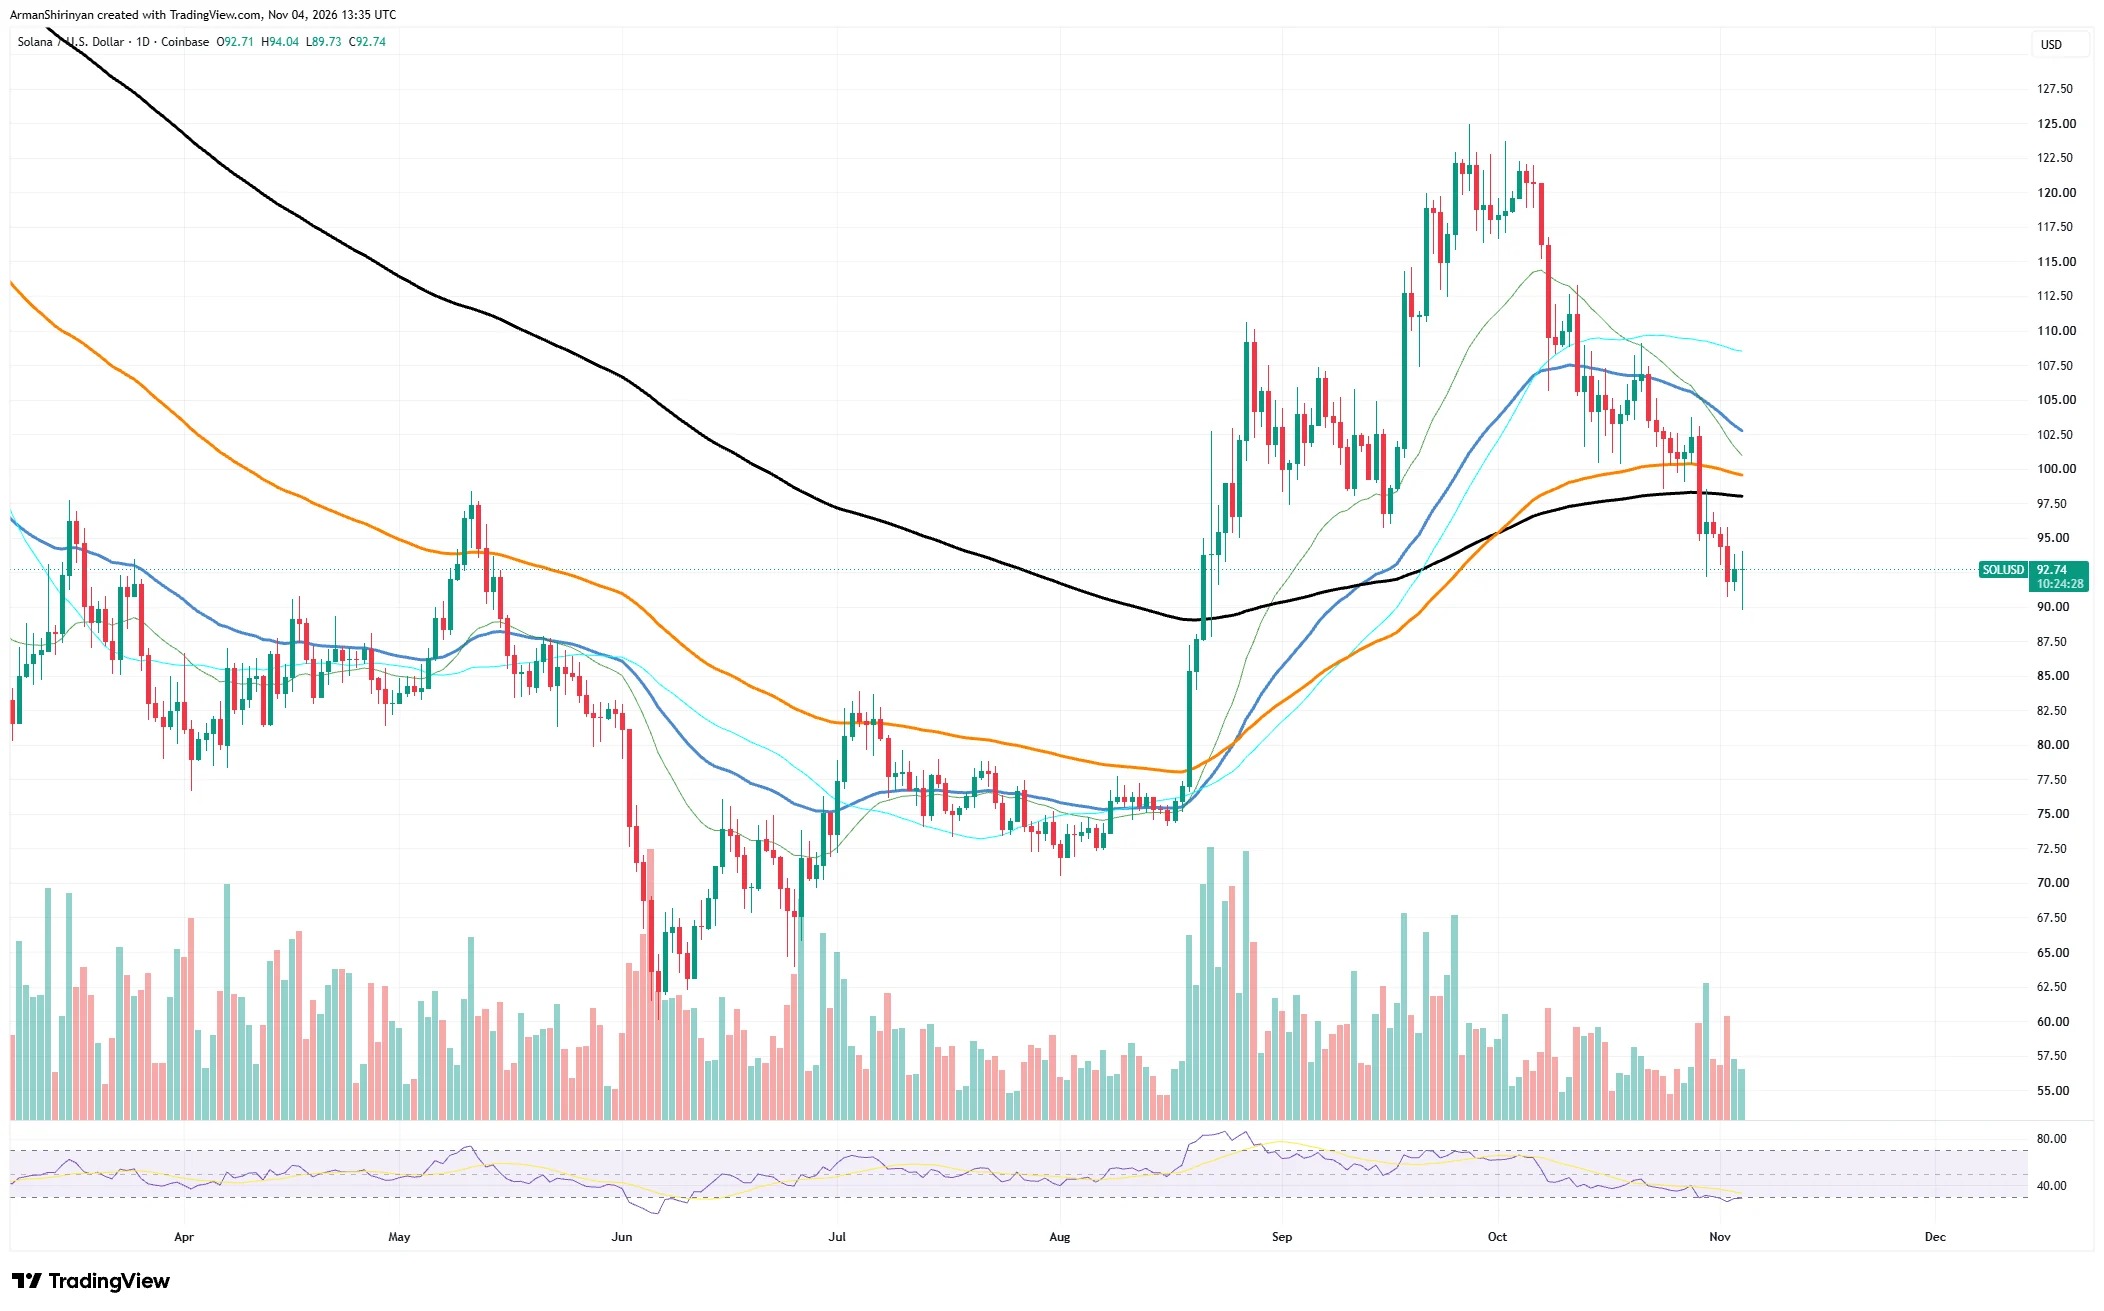
The Relative Strength Index (RSI) of Solana has slipped to the lower end of its recent range, approaching the oversold area. The selling pressure may eventually dissipate, but this indicator has not yet shown a convincing bullish reversal.
The recent support level is around $90, and buyers may try to stop the decline at this point. If it clearly breaks below this level, Solana could fall to $85, followed by the $80 area. On the other hand, regaining above $100 would be the first step in rebuilding bullish momentum.
What is not favorable for the bulls is that after breaking below several moving averages, Solana still maintains a bearish stance, with sellers firmly in control of the situation.
Ethereum ( ETH ) attempts to rebound around $2317
Ethereum ( ETH ) is attempting to stabilize itself after the recent correction, which erased most of the gains made in September. There are initial signs of a rebound from the recent lows, but this second-largest cryptocurrency by market value still faces significant resistance, so the short-term outlook is not clear.
According to the ETH / USD daily chart from November 4th, the trading price of Ethereum was around $2317. After a brief decline to the $2200 range, it rebounded slightly. However, buyers have not yet regained control.
The recent weakening began in early October when it was rejected at the resistance range of $2750 to $2800. Since then, ETH has continued to show lower highs and lower lows, which is a clear signal of ongoing selling pressure.
ETH The current trading price is below several important moving averages, including the short-term averages around $2400 to $2500.
The recent resistance level is around $2350, and if it approaches $2400, selling pressure may increase further. ETH A valid breakthrough above these levels is needed to indicate that the downward trend is weakening.
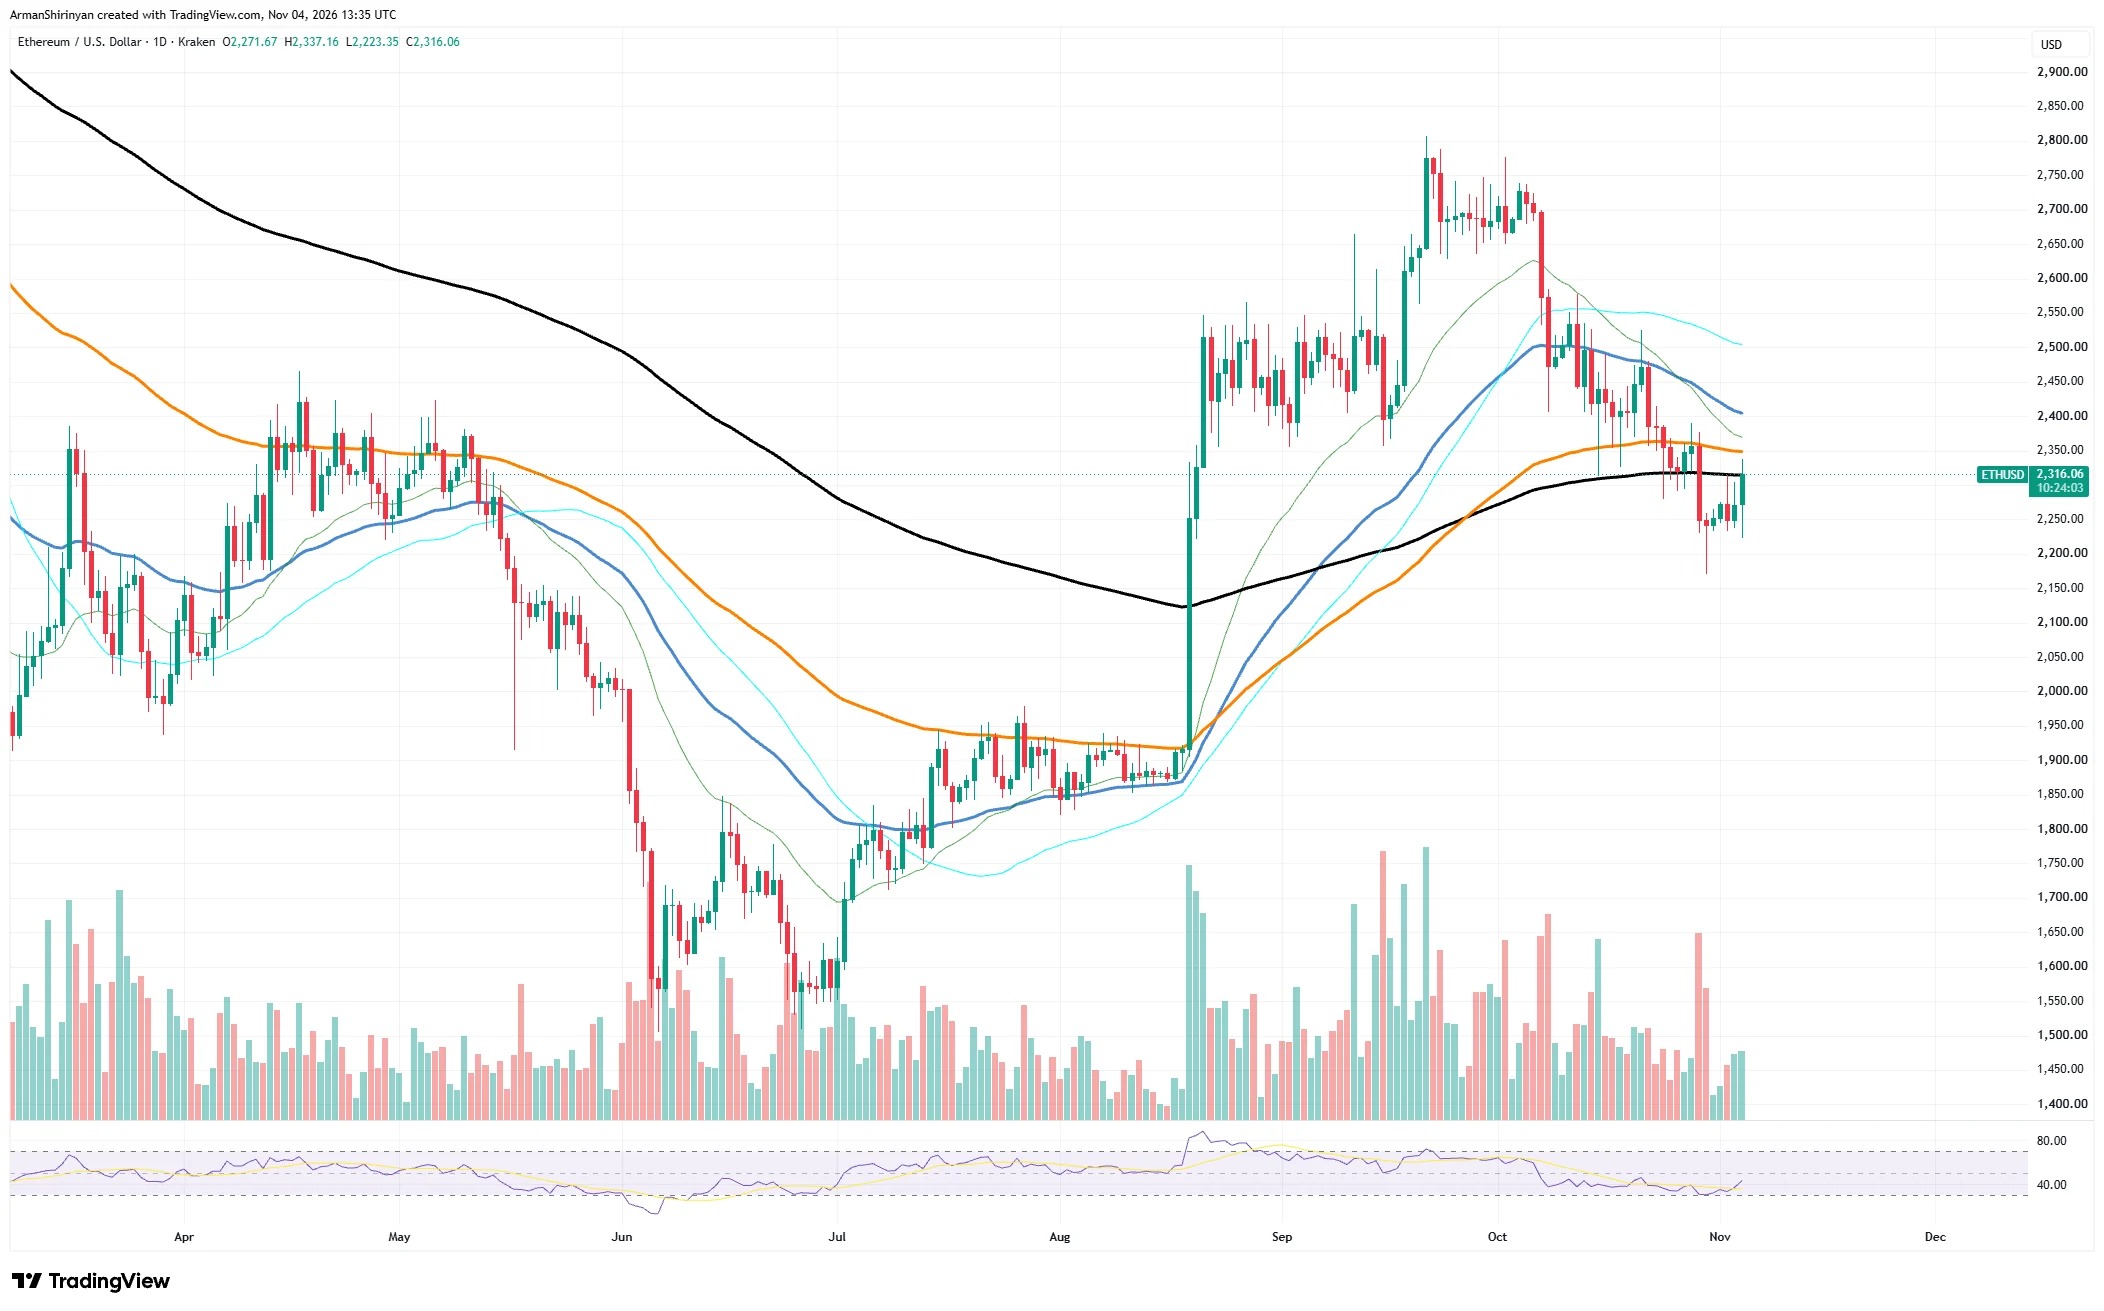
Ethereum also hovers around the long-term moving average of around $2,300, which makes the current price range a key position for the next phase of trend development.
The Relative Strength Index ( RSI ) has fallen significantly from its October highs, due to the weakening bullish momentum. However, RSI has begun to stabilize in the lower half of the range, which indicates that selling pressure may be easing. This could potentially contribute to a short-term rebound, but a flat trend in RSI alone is not sufficient to confirm a reversal in the trend.
The recent support level is around $2,250, followed by the psychologically significant $2,200 mark. If this level is broken through, it could open the door for a further pullback to $2,100.
On the upside, regaining $2,350 would be a good first step, and if it breaks above $2,400, that would provide even stronger support for a price rebound to $2,500.
NEAR Protocol ( NEAR ) Falls below the key moving average
NEAR Protocol ( NEAR ) failed to maintain the gains from October, and sellers regained dominance. NEAR has once again entered a correction mode, with prices falling below several important technical indicators.
According to the daily chart from November 4th, the trading price of NEAR is around $4.02, which is significantly lower than the high of nearly $6 in October. NEAR has fallen below the short-term moving average, which clearly indicates that the bullish momentum is weakening.
The range of $4.30 to $4.60 has now become a key resistance level, where multiple moving averages intersect. If the price can once again rise above this range, it could create room for a rebound to $4.80, or even to $5.
However, NEAR is still above the longer-term moving averages around $3.65 and $3, so a larger-scale rebound has not been completely destroyed.
The Relative Strength Index ( RSI ) has fallen to the lower half of the range, indicating that buying momentum is weakening. It is approaching the oversold area, but there are no convincing bullish reversal signals yet.
Compared to the explosive rise in September, trading volume is also quite sluggish.
The recent support level is at $3.80, with a stronger support level around $3.65. If these levels are clearly broken through, NEAR could fall further to $3.40. On the contrary, regaining $4.30 would be an early signal of a return for buyers.
Although there is still some support below the longer-term trend, the short-term outlook for NEAR is currently bearish.
Zcash ( ZEC ) Testing the resistance level of $1300 after a rebound
Zcash ( ZEC ) seems to have become active again after rebounding from the recent consolidation lows. Despite a significant pullback from the October highs, this privacy coin is still trading above the main long-term moving averages.
According to the daily chart from November 4th, ZEC has traded at around $1288 after recently falling to the $1150 range.
ZEC is currently attempting to regain the $1,300 resistance level; this position has repeatedly limited price increases throughout October. If it can break through this barrier, it may open up space for a further rise to $1,350 and then challenge the psychologically significant level of $1,400.
However, the sellers have been appearing around these price levels, so the buyers need stronger momentum to achieve a real recovery.
ZEC still remains firmly above the long-term moving averages of around $1050 and $850, which makes the larger-scale trend appear relatively healthy.
After declining during the October pullback, the Relative Strength Index ( RSI ) has rebounded to around the neutral level of 50. The selling pressure may be easing, but the indicator has not yet confirmed a clear bullish turn.
For now, the chart performance of Zcash is stronger than that of many altcoins, but before the bulls can celebrate, it still needs to confirm a break above $1300.