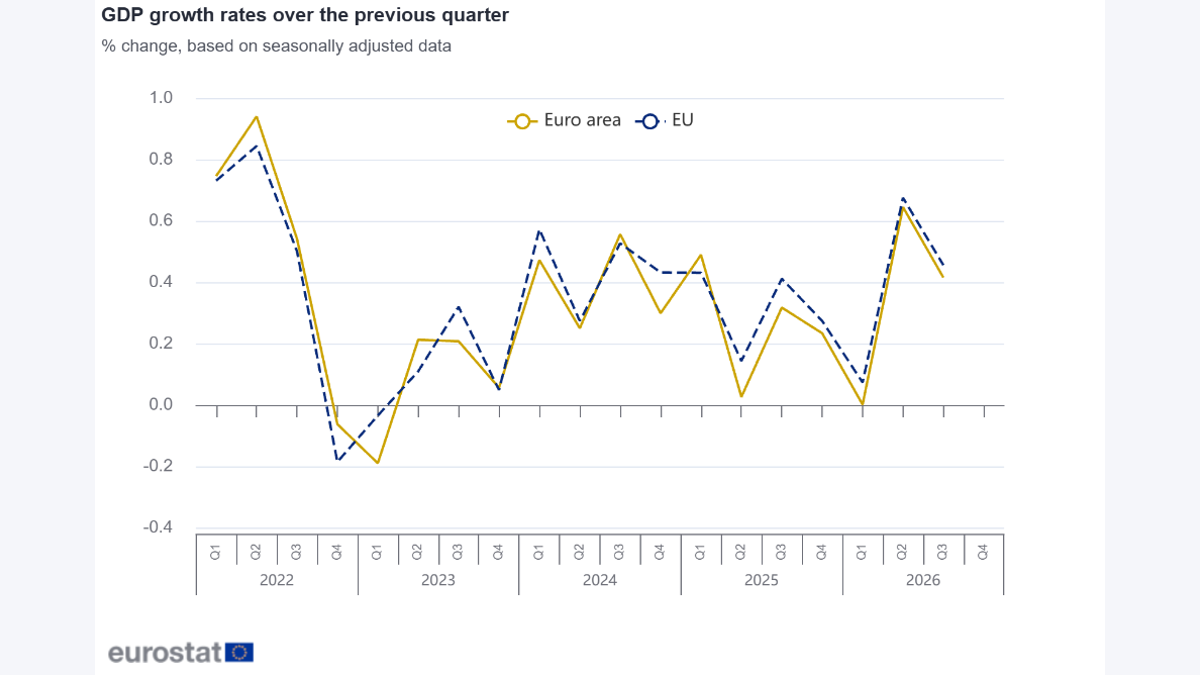















Within the same table with the identifier GDP, the quarter-on-quarter growth rate in the eurozone dropped from 0.6% to 0.4% in the third quarter, while the year-on-year growth rate increased from 1.2% to 1.3%. If only one row of data is considered, the economic trend might appear to tell two opposite stories. According to the preliminary rapid estimates released by the European Union Statistics Office on October 30th, these two sets of figures need to be viewed together, and readers are advised to first distinguish between the time periods being compared.
0.4% compares the third quarter with the second quarter, reflecting the progress speed of the most recent quarter; 1.3% compares this year's third quarter with the same period last year, recording changes over a longer time frame. It is possible for the speed to slow down recently while still exceeding that of a year ago. Although there has been a slight year-on-year increase, this does not erase the weakening of the quarterly trend; the slowdown in the quarter does not mean that this quarter has turned into negative growth.
Looking at the four quarters together
After seasonal adjustment, the eurozone saw a quarter-on-quarter growth of 0.2% in the fourth quarter of 2025, flat growth in the first quarter of this year, and a growth of 0.6% in the second quarter, with 0.4% growth in the third quarter. This series indicates that the positive growth seen in the second quarter continued into the third quarter, but it did not maintain the same pace. Comparing with a stronger quarter or with the situation from a year ago naturally presents different perspectives.
The EU as a whole also has similar figures. In the third quarter, there was a quarter-on-quarter growth of 0.5%, which is lower than the 0.7% in the second quarter; year-on-year, it grew by 1.5%, which is higher than the 1.4% in the second quarter. Since the EU and the Eurozone have different member compositions, the names cannot be interchanged when making references. The fact that both groups showed a slowdown in quarter-on-quarter growth and a slight increase in year-on-year growth indicates that the impact of the comparison baseline on the narrative is not unique to the Eurozone.
These growth rates are based on chain-based physical quantities, which officials use to measure changes in production activities. They are not the same indicators as corporate sales figures, residents' incomes, or price increases. To discuss a company's operating situation, it is necessary to take into account its location and type of business further. Aggregate data can provide a common context, but industry orders and household budgets require more detailed analysis.
5.5% of Ireland has changed the overall way of reading
The national data provides another layer of information. Among the members for which data has been released, Ireland saw a quarter-on-quarter growth of 5.5% in the third quarter, which is higher than that of other countries listed; Estonia, Spain, and the Netherlands all experienced a growth of 0.6%. Germany grew by 0.2%, France declined by 0.1%, Italy remained stable, and Lithuania saw a decrease of 1.0%. If we consider all countries as just 0.4% of the total, it tends to mask the significant differences among them by presenting a uniform picture.
Ireland, in particular, needs to be viewed in conjunction with its previous values. In the first quarter of this year, there was a year-on-year decline of 7.8%, followed by a growth of 10.2% in the second quarter, and another 5.5% growth in the third quarter. Its year-on-year trend also changed from a decline of 0.4% in the second quarter to a growth of 3.6% in the third quarter. These trends and magnitudes remind readers that behind the high growth rates in individual quarters, there are significant fluctuations in the series data.
The official also added a special note regarding the Irish data: this rapid estimate is part of the pioneering experimental output of the Irish Statistical Office, and the data used is not yet complete. This preliminary figure is mainly based on data from the supply side; as results from the demand side are incorporated, the figures may be revised. Therefore, the high figures for Ireland are both a fact that must be explained in this table and should not be regarded as a stable growth trajectory.
The gap in national growth rates does not directly indicate each country's contribution to the overall growth of the eurozone. 5.5% is Ireland's own rate of change, and 0.2% is Germany's own rate of change; to calculate which country contributes more to the total, weightings and contribution data are also needed. Setting the tone for the entire region based on the highest growth rate skips this step. For cross-border businesses, the specific market exposure is closer to the actual business decisions than the overall figure.
The initial value is set for speed, but the expenditure structure is still being determined.
This rapid estimate is based on data from 19 member countries, covering 96% of the Eurozone GDP and 94% of the EU GDP. The high coverage rate allows for timely assessment of regional totals. However, the statistical bureau has made it clear that the data is incomplete and will be revised in the future. This release does not include any revisions to the regional GDP data from previous quarters.
The next quarter is estimated to be scheduled for November 13th, with subsequent regular sessions expected on December 7th and January 19th of the following year. There is a time lag between the quick releases and the complete data. Readers can now confirm that the growth rate for the most recent quarter has slowed down compared to the previous quarter, but it is not yet possible to discern the respective driving forces behind consumption, investment, or inventory from this table.
This will change the way data is used in decision-making. When companies face markets such as Germany, France, Spain, or Ireland, they see different quarterly performances; when discussing the overall regional demand, they must also take into account both the month-over-month and year-over-year trends. The preliminary figures provide an earlier point of entry for information and also leave the cost of using them to the reader: first identify the comparison benchmarks, and then decide to what extent this overall change affects their own business.